How to replicate user errors without the user with Breadcrumbs and Sessions
Posted Jun 29, 2018 | 2 min. (305 words)If you need to replicate a user error, you’ll know how difficult it can be to pinpoint the cause. Usually, you’d look at the stack trace or ask the user themselves. However, that’s a lot of guesswork, especially if the stack trace is obfuscated.
We’ll show you how to replicate the error faster using Crash Reporting’s Breadcrumbs and the Real User Monitoring Sessions feature.
The benefits include:
- Replicate a user error much faster
- Increase visibility into the cause
- Triage errors with the user in mind
Note: You’ll need a Platform Plan to follow this tutorial
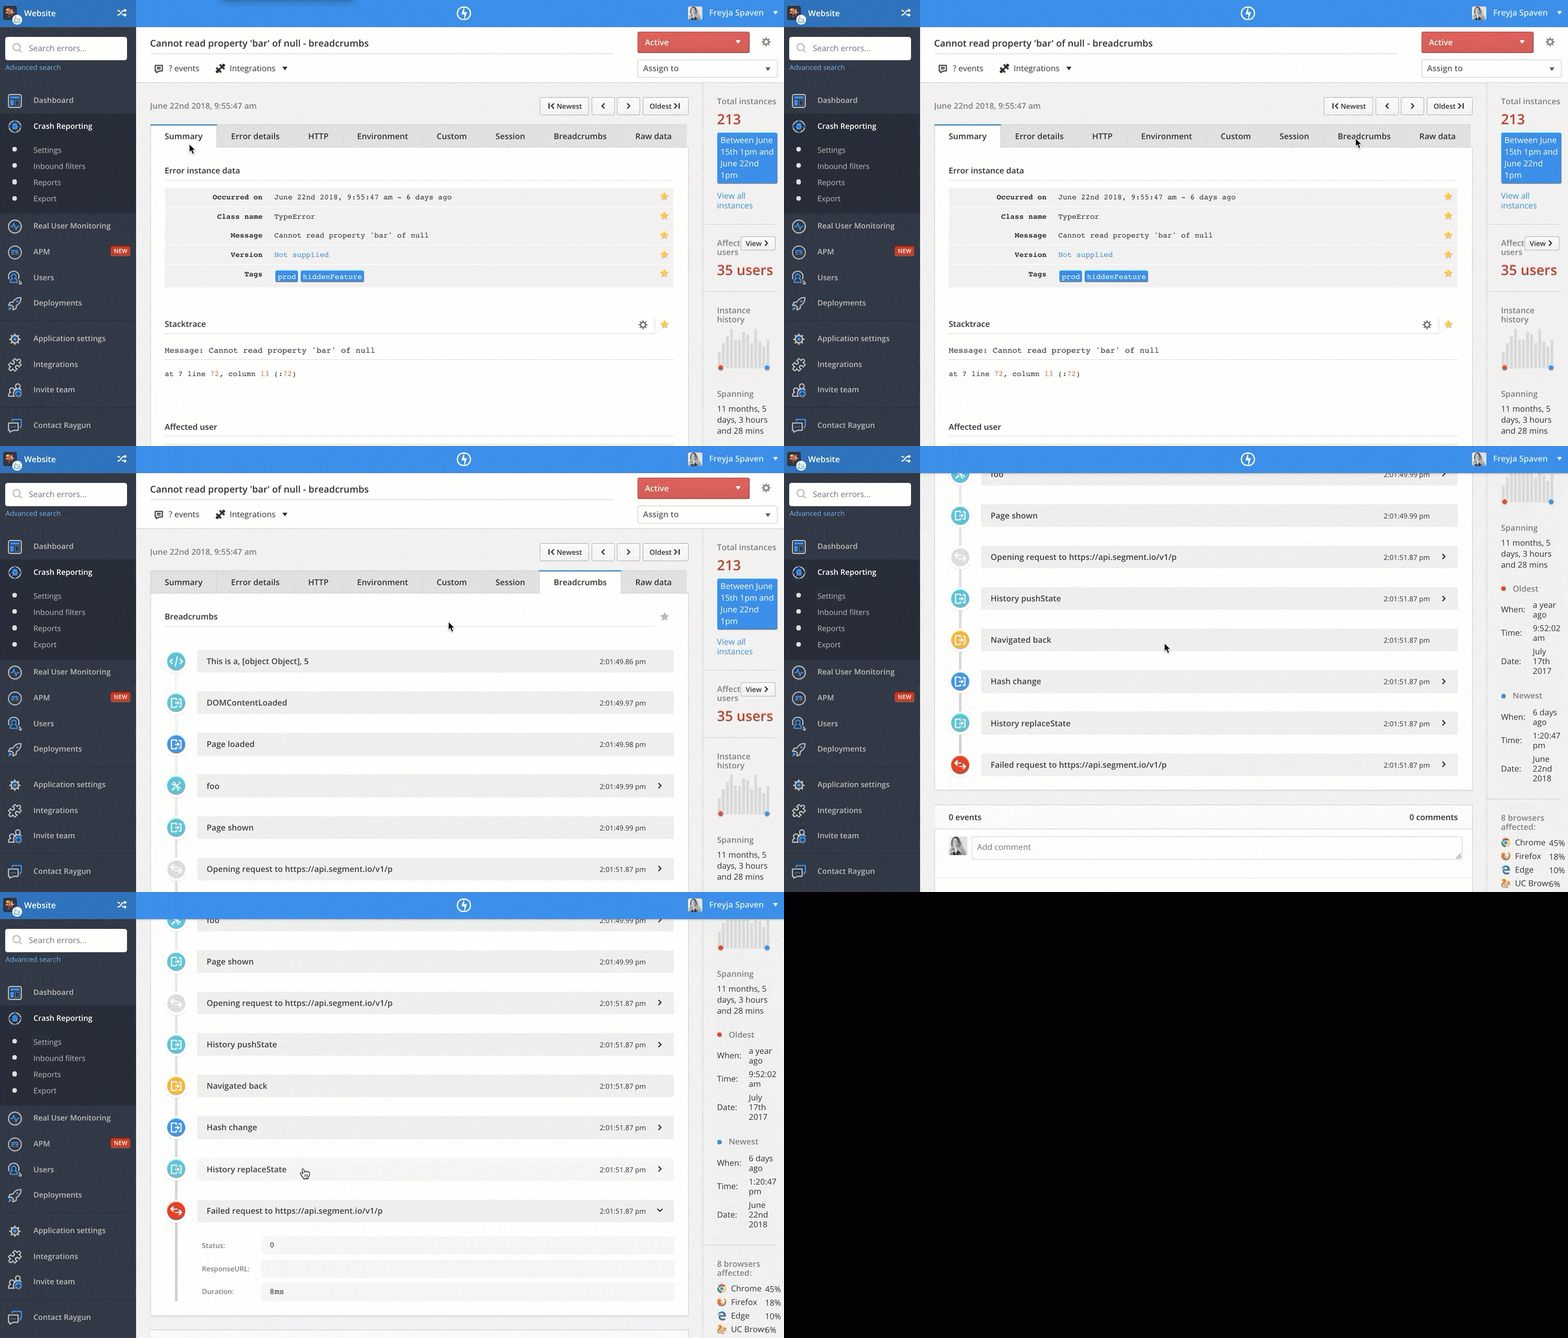
Step 1. See how the error occurred
In your dashboard, click on the error you’d like to investigate. Head to the ‘Breadcrumbs’ page. Scroll to the bottom of the breadcrumbs to see the origin of the error.

Inside the Breadcrumbs page, you can expand each Breadcrumb for more information on the error. This helps you understand the cause of the error.

Step 2. Understand the actions a user took to cause the error
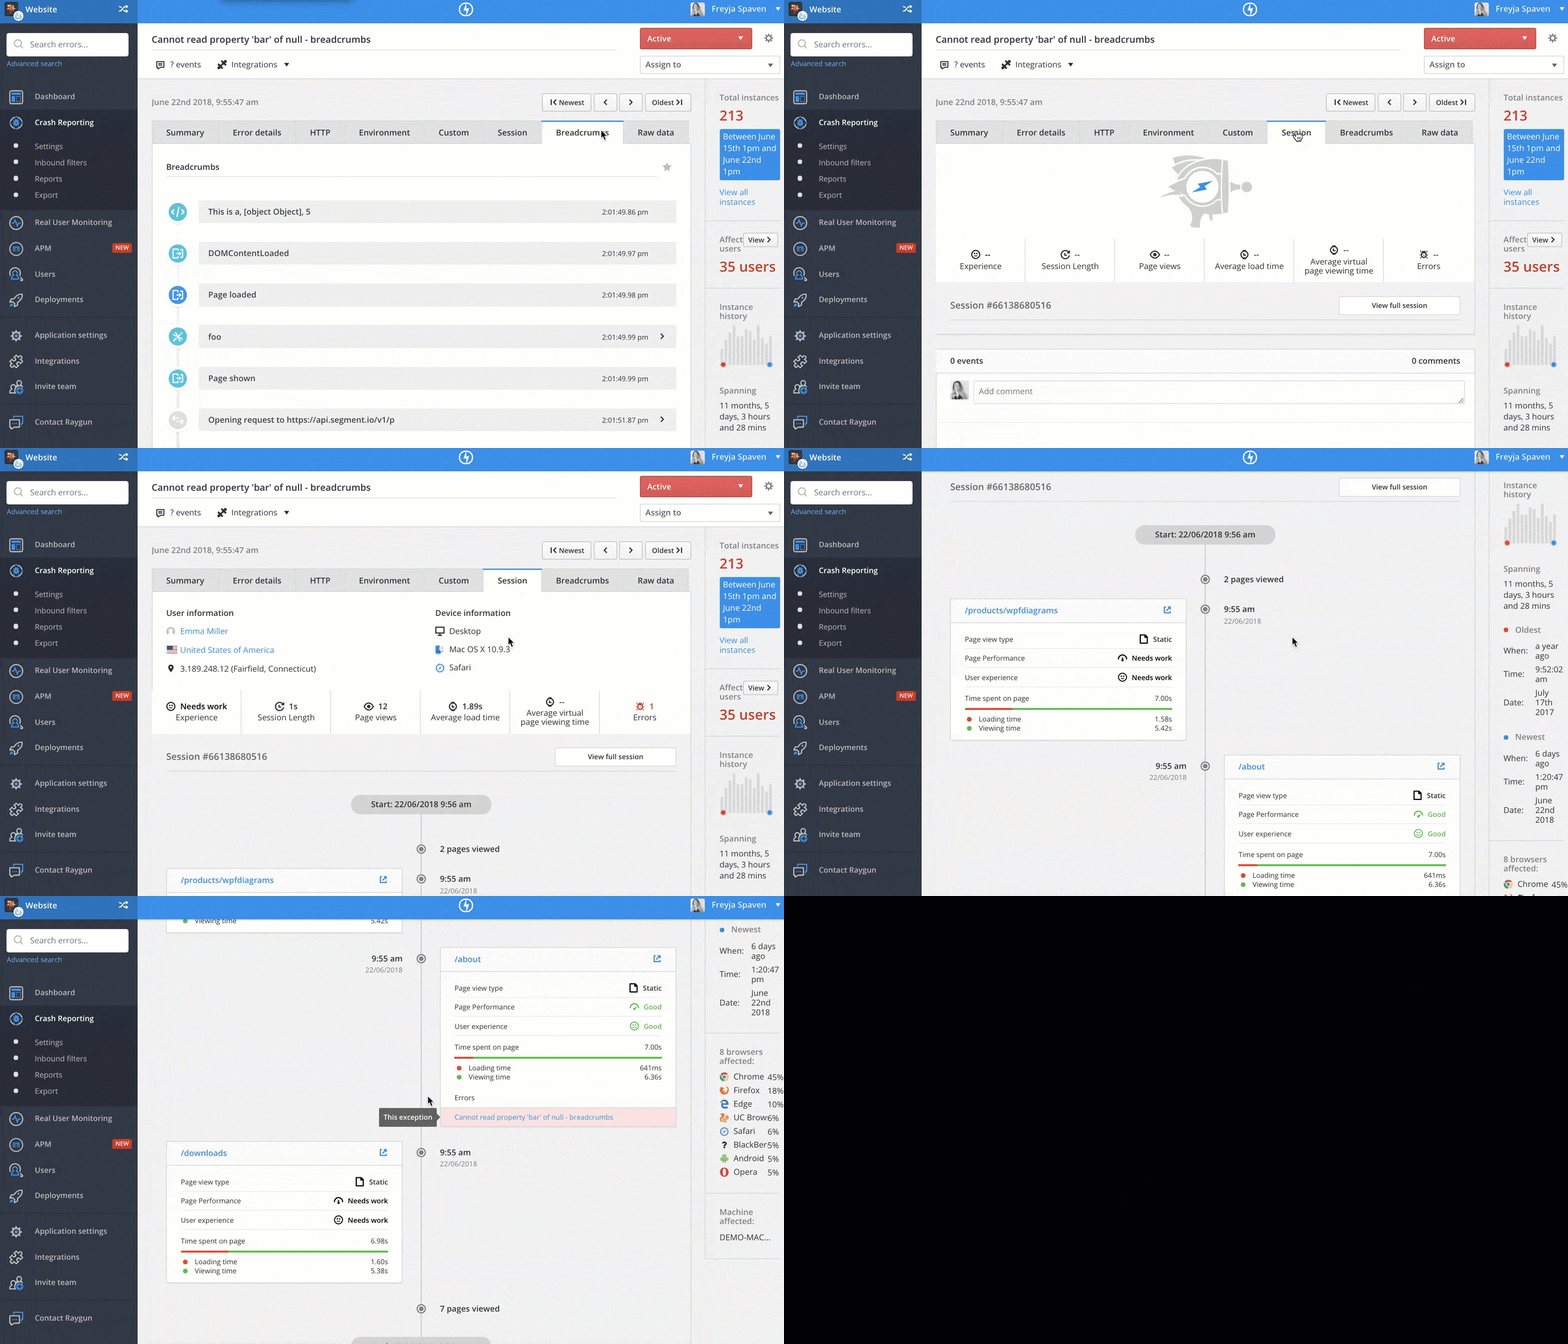
Once you have seen the cause of the error, head to the ‘Sessions page’ for context on the user the error affected and the actions they took to encounter the error.

Inside the Session page, you can see all the details you need to replicate the error in your local environment:
- Device
- Operating system
- Browser
You can also view the actions a user took to encounter an error. For example, you can scroll down to see which page an error occurred on, and what time. You will also get information on their overall user experience and how quickly the page loaded for them.

Using Breadcrumbs and Sessions together makes it easier to replicate errors, saving you time when fixing errors for end users.
Do you have questions about replicating errors? Get in touch with a team member.