The 2023 guide to React debugging
Posted Mar 20, 2023 | 13 min. (2736 words)As React is the most popular JavaScript framework for creating component-based applications, you have access to a solid ecosystem of tools, resources, and best practices that can help with React debugging when something goes wrong.
To create a high-quality React application, you can’t skip over the debugging phase of your software development life cycle including everything from addressing error messages coming up in the development phase to monitoring live errors in production.
In this guide, we’ll look at the ins and outs of React debugging, take a peek at the most common React bugs, and see the best React debugging tools available today.
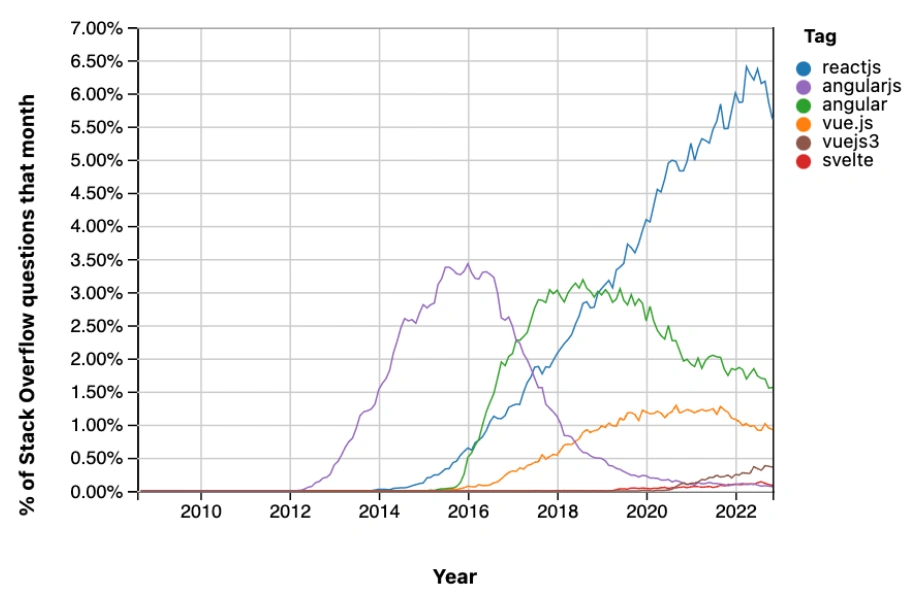 React is the most popular JS framework.
Quicklinks
- What is React debugging?
- The 4 most common types of React errors
- Prerequisites before React debugging
- The 4 best React debugging tools
- Chrome DevTools
- React Developer Tools
- Visual Studio Code JavaScript Debugger
- Raygun4JS and Raygun APM
- Final thoughts on React debugging
What is React debugging?
React debugging is the process of finding and resolving errors in a React application. As React is a JavaScript library, React debugging is a type of JavaScript debugging, and you can use many of the same techniques and tools that you’d use for debugging regular JavaScript code.
In addition to the core React framework, there are also many React-based client-side libraries you may need to debug. Some examples are MUI (Material UI), React Bootstrap, and Fluent UI for web-based user interfaces, Gatsby and Docusaurus for static site generation (SSG), and React Native for native app development.
When it comes to debugging applications created with these libraries, you can treat them as regular client-side React applications and use the same debugging tools and techniques (see a guide to debugging React Native apps here).
However, not all React apps are rendered in the browser. Server-side rendering (SSR) is a popular web performance optimization technique that many React applications take advantage of.
You can treat these SSR React apps as Node.js applications and use Node.js debugging tools and best practices to resolve the arising issues. Some React debugging tools we’ll discuss later in this guide (Visual Studio Code and Raygun) also allow you to debug React applications rendered on the server side.
The 4 most common types of React errors
While some React bugs throw error messages so that you know what has gone wrong, there are also silent errors that you can only identify with debugging and monitoring.
React errors can be grouped into one of the following four categories:
Let’s break down what these refer to.
1. UI bugs
React apps are rendered from reusable components, so the user interface doesn’t always end up the way you expected.
UI bugs are usually easier to recognize, as you can see that something doesn’t look quite right on the screen (for example, an element such as a button or the layout itself).
2. Logic errors
Logic errors are bugs in the behavior of an application — in other words, it doesn’t perform one or more operations in the expected way.
These bugs are harder to detect, as they aren’t visible on the screen like UI errors, don’t always result in a crash, and don’t always throw an error message.
3. Networking errors
Networking errors happen when a network request fails and one or more resources don’t download correctly or fast enough. This can apply both to requests sent to your own server and third-party assets such as embedded content or static files stored on a CDN (Content Delivery Network).
Network bugs can also result from the wayward behavior of third-party services your React application relies on — in this case, you’ll need to troubleshoot the issue together with the service provider or find another service.
4. Regression bugs
Regression bugs refer to features that used to work in the past but have stopped working, usually after a new code release.
React apps that grow fast can be prone to this type of error. However, with thorough testing, including regression testing and continuous monitoring, you can prevent new features from causing regressions in existing behavior.
Prerequisites before React debugging
To debug a React app, you’ll need to set up the following development environment:
-
a local Node.js server installed on your computer (you can download Node.js from here)
-
the React.js package installed on your project
-
an existing React app that you can debug (or you can use the Create React App to start a React app from scratch)
-
a source code editor with React syntax highlighting, such as Visual Studio Code
-
a web browser with developer tools and Incognito mode, such as Google Chrome
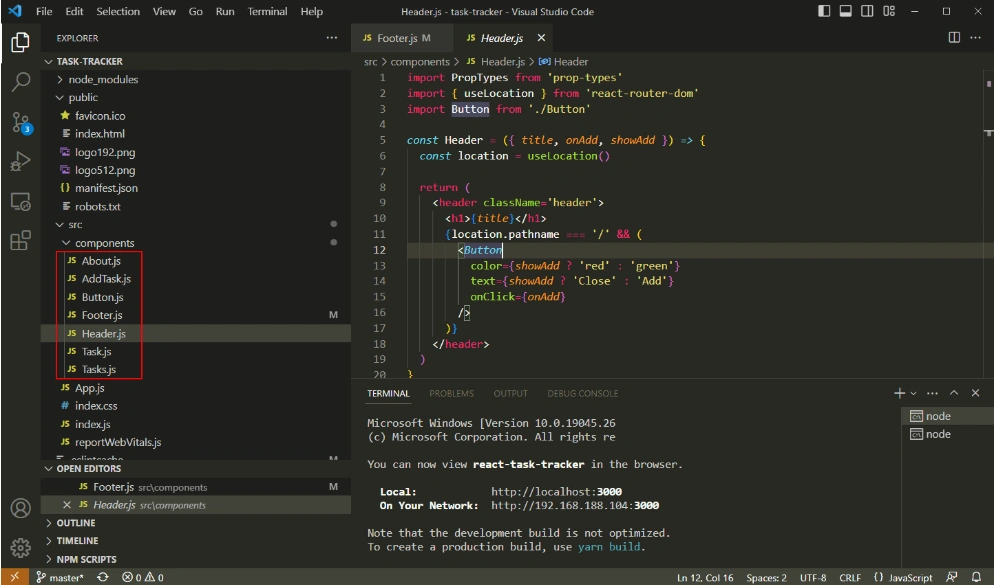
For this guide, I’ll use Brad Traversy’s task tracking application — you can watch his React crash course on YouTube where he shows step-by-step how to build this application.
After setting up the project, this is what it looks like in Visual Studio Code. As you can see, it’s a basic React application that consists of seven components (About.js, AddTask.js, Button.js, Footer.js, Header.js, Task.js, Tasks.js):
The 4 best React debugging tools
Now, let’s get into the best tools you can use to debug React applications.
1. Chrome DevTools
Chrome DevTools is a set of advanced developer tools integrated into Google Chrome and other Chromium-based web browsers such as Vivaldi, Opera, and Brave. There are a couple of ways to open Chrome DevTools — the easiest one is to use the F12 keyboard shortcut on Windows and Linux and Fn + F12 on Mac computers.
For debugging, whether it’s React or any other code, always open your browser in Incognito mode. This disables your browser extensions so that they won’t affect debugging (some of them add elements or functionality to the web pages you load).
This is what our example task tracker application looks like in Chrome DevTools:
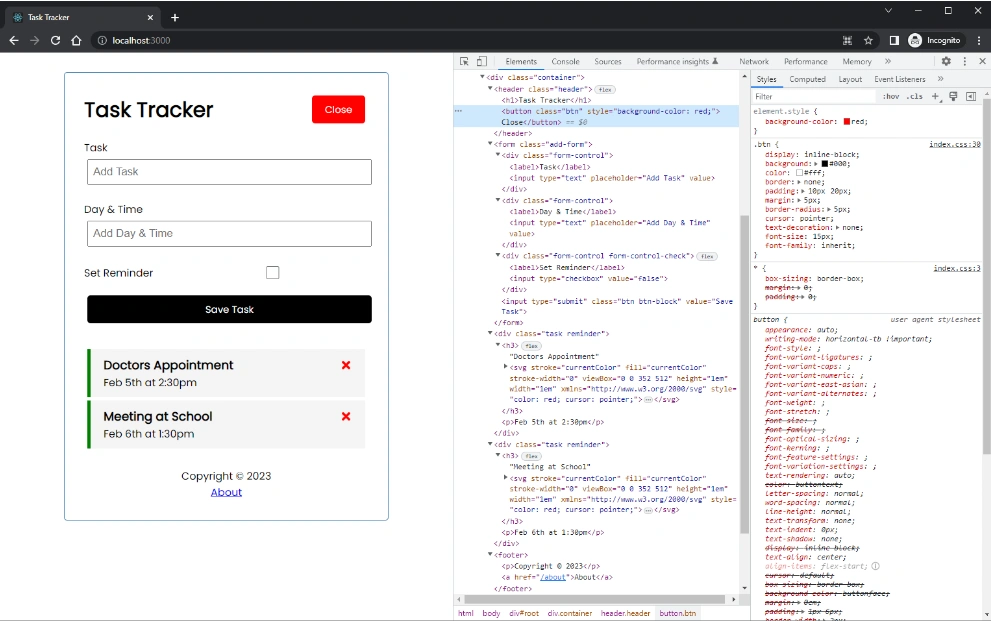
While Chrome DevTools doesn’t have a React debugging tool by default, you can use its powerful JavaScript debugger to debug React errors.
Chrome DevTools has three tabs you can use for React debugging:
- Console
- Sources
- Network
The Console tab is basically a regular JavaScript console. It allows you to run console statements such as console.log(), console.warn(), and console.error(), just like when debugging native JavaScript code.
The Sources tab lets you set breakpoints or use the debugger statement (the code equivalent of breakpoints) to pause code execution, while the Network tab gives you insight into networking errors and performance issues.
For React debugging, the most important part of Chrome DevTools is the Sources tab because breakpoints allow you to pause code execution at any point so that you can examine what happens inside your code. Chrome DevTools shows you the call stack and variables, lets you step over the statements one by one, and more.
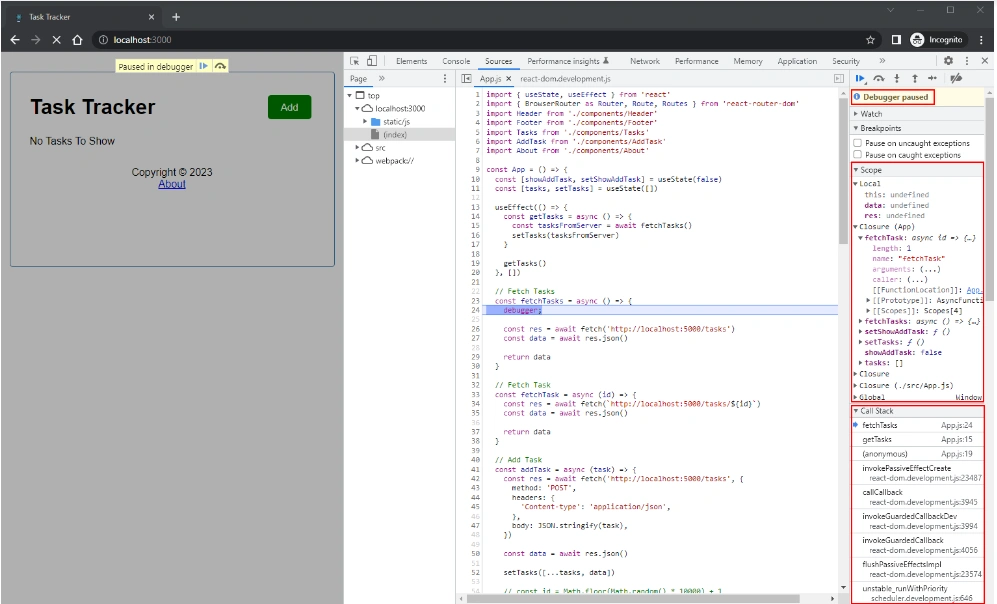
For instance, in our example app, you might want to see what happens inside your code right before the tasks are fetched from the database. You can do so by simply adding the debugger statement before the task list is fetched (you can find the code example below in the App.js file in the GitHub repo of the task tracking application):
**
// Fetch Tasks
const  fetchTasks  =  async () => {
     debugger;

     const res =  await  fetch('http://localhost:5000/tasks')
     const data =  await res.json()

     return data
}
**
In the browser, you can see that Chrome DevTools has paused code execution right at the point where the debugger statement has been added — the tasks are not loaded yet.
Chrome DevTools shows you the global and local variables in the Scope pane together with the call stack at that point so that you can analyze them:
As an alternative to the debugger statement, you can also add breakpoints in Chrome DevTools manually, by using the built-in breakpoint functionality.
You have access to the following types of breakpoints:
- line-of-code breakpoints
- conditional line-of-code breakpoints
- logpoints
- DOM breakpoints
- XHR breakpoints
- event listener breakpoints
- breakpoints set at caught and uncaught exceptions
- function breakpoints
To see what exactly these mean and how to use them, check out this breakpoint guide by Google.
2. React Developer Tools
React Developer Tools is Facebook’s open-source JavaScript library for React debugging. It’s available as an extension to the Chrome, Firefox, and Edge browsers.
Since React Developer Tools is a browser extension, you can’t run it in Incognito mode. However, this isn’t a problem, as React Developer Tools has been created to inspect the application structure and profile the performance issues of isolated React applications, so it’s not affected by code that other extensions may run in your browser.
Note that React Developer Tools is not an alternative to Chrome DevTools — instead, it lets you ‘see’ the components and performance of your React application at a high level. On the other hand, Chrome DevTools shows your React app as a regular web page so you can inspect the individual HTML, CSS, and JavaScript files.
React Developer Tools adds two extra tabs to your Chrome DevTools:
-
Components: for component architecture
-
Profiler: for application performance
By default, both of these tabs allow you to inspect the developer build of your application.
If you want to use them to debug the production build, here are some things to know:
-
The Components tab does show your components in production mode, but their names are abstracted away (for example, in our example app, the
Headercomponent appears asx). However, as the application architecture is the same in development and production modes, it’s easier to inspect the developer build. -
The Profiler tab doesn’t support production builds. This is because profiling adds performance overhead to the application which would negatively impact performance-optimized production builds. It’s still possible to profile production builds, but you’ll need to create a production build with profiling enabled.
Now, let’s see how to inspect and debug a React application using these two tools.
The Components tab
This is what our example app looks like in the Components tab of React Developer Tools:
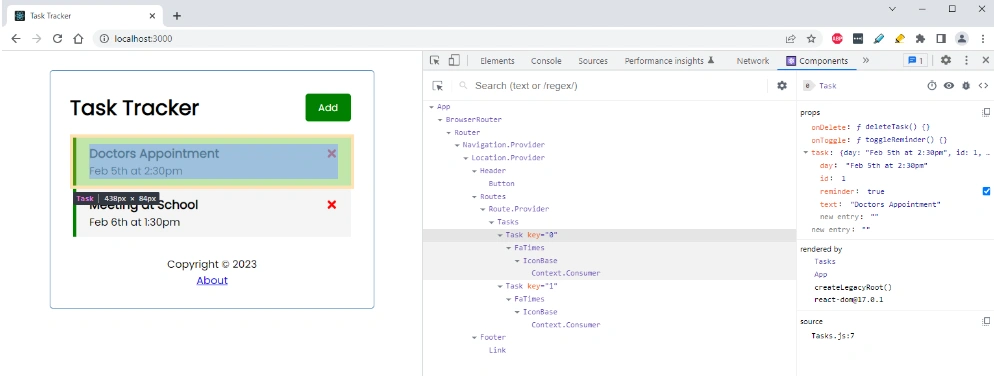
As you can see above, you can inspect every component that is rendered on the screen, including its subcomponents, props, state, and render tree.
Essentially, the Components tab visualizes the relationships between your React components, which can help a lot with both debugging and development.
The Profiler tab
To use the Profiler tab, you’ll need to perform an action with your app. For example, I’ll add an extra task to the task tracker app. To profile React performance, click the ‘Record’ button, perform the action(s), then click the ‘Record’ button again to stop profiling.
The Profiler tool shows the result in three charts (flame graph, ranked chart, timeline) — here’s the flame graph that visualizes the performance of every user action in detail:
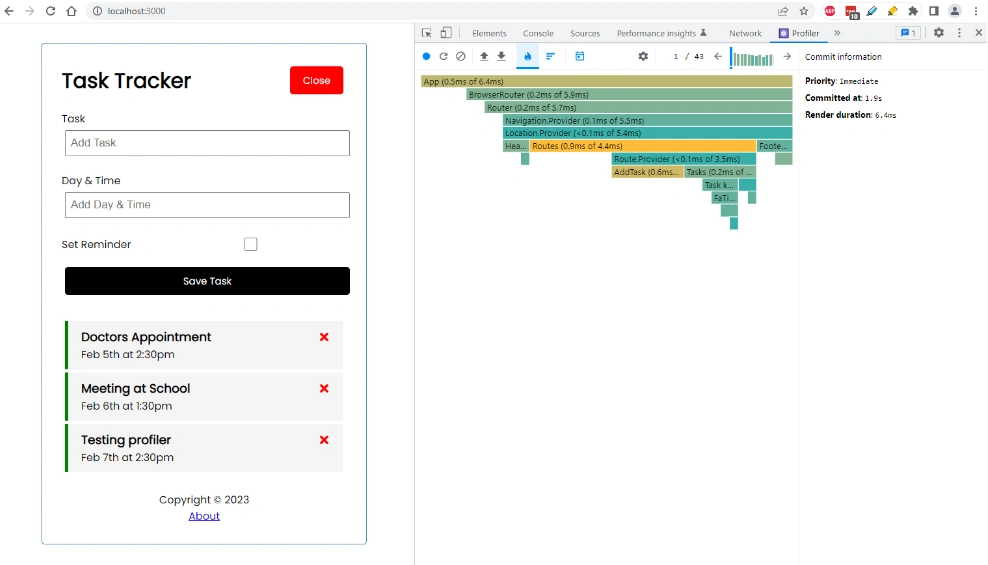
There’s a bit of a learning curve to mastering the React profiler, but it’s worth the effort because it lets you measure the rendering performance of a React application. Here are some resources you may find useful:
-
The official API reference guide at React.dev
-
Viduni Wickramarachchi’s tutorial at Bits and Pieces
-
JeB Barabanov’s tutorial on his website
3. Visual Studio Code JavaScript Debugger
Visual Studio Code (VS Code) is a popular source code editor developed by Microsoft. It supports multiple programming languages and incorporates many useful development features into a user-friendly dashboard.
React debugging with VS Code provides you with a powerful workflow because you can do almost everything inside your code editor. For example, you can open several terminal instances, write code using IntelliSense and React syntax highlighting, commit your work to GitHub, debug your applications, and more.
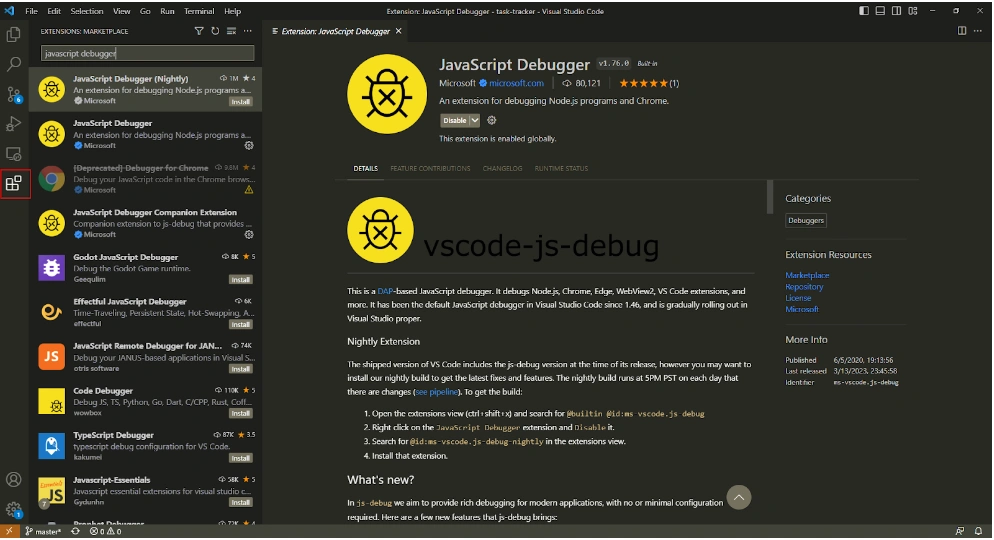
VS Code provides JavaScript debuggers as extensions — you have a couple of options to choose from. You can find and download them right from the code editor by clicking the Extensions icon in the leftmost (vertical) menu.
I’ll use the JavaScript Debugger extension by Microsoft as an example, which allows you to debug both client-side React applications in Chrome and server-side React applications running on a Node.js server:
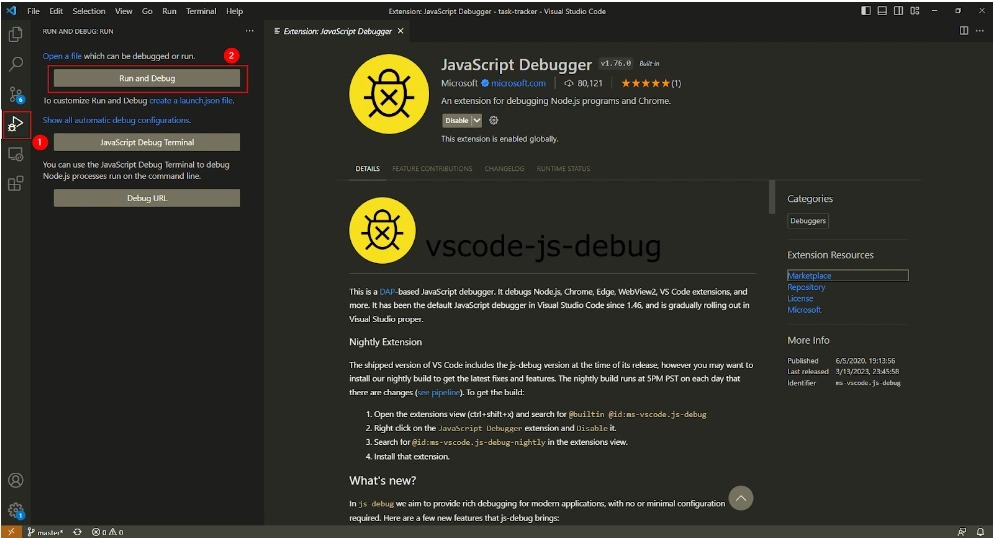
Once the JavaScript Debugger extension is installed in your code editor, you can open it by clicking the Run and Debug icon in the leftmost menu.
To run the debugger, you’ll need to create a launch.json config file. To do so, click the Run and Debug button:
Then, select the debugger application you want to use (to debug the example app, I chose the Web App Chrome option):
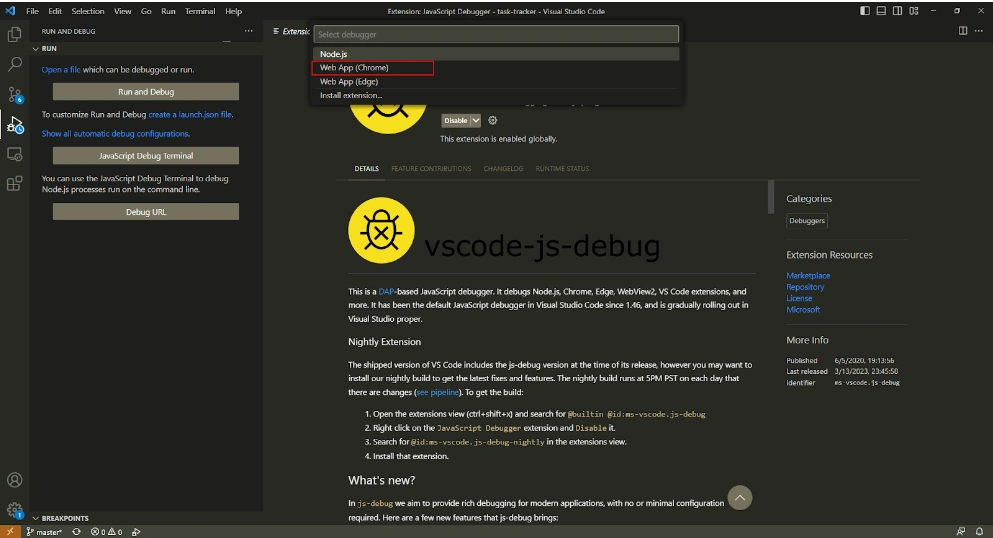
VS Code will automatically add a launch.json file to the folder of your React application.
Note that you may need to change some things in the default config file. For our example application, I used the following settings (webRoot is where your application code is located — applications created with Create React App use the src folder):
**
{
    "version": "0.2.0",
    "configurations": [
        {
            "name": "Launch Chrome",
            "type": "chrome",
            "request": "launch",
            "url": "http://localhost:3000",
            "webRoot": "${workspaceFolder}/src"
        }
    ]
}
**
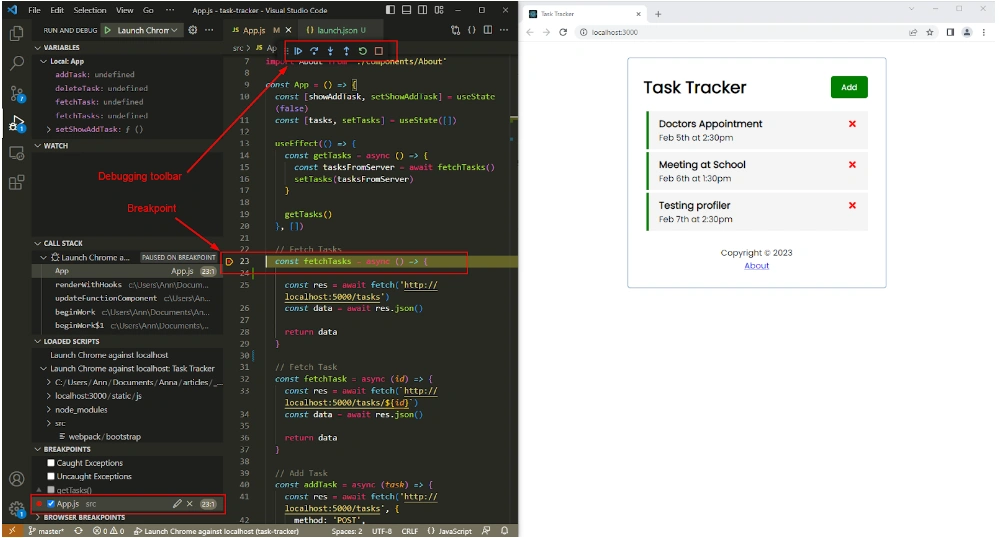
Save the file, and VS Code will add a ‘Launch Chrome’ button to your debugger panel on the left. Click it, and VS Code will open Chrome in debugging mode.
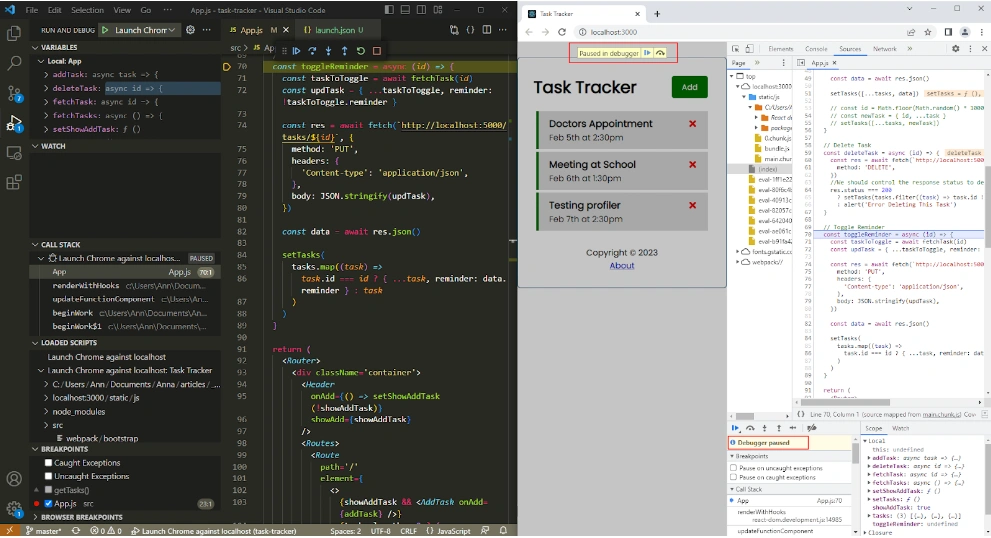
Now, you can pause code execution by setting breakpoints from your code editor, use the debugging toolbar to step over or into functions, inspect the call stack, and more:
You can also open Chrome DevTools to see that the code execution was, indeed, paused at the line where we added the breakpoint in Visual Studio Code:
You may find that React debugging with Visual Studio Code is an improvement compared to Chrome DevTools because you don’t have to move between the browser and code editor to change the code and you have access to IntelliSense, pre-set browser breakpoints, and other powerful features.
However, on the other hand, Chrome DevTools gives you access to many other types of pre-defined breakpoints that you don’t have in VS Code.
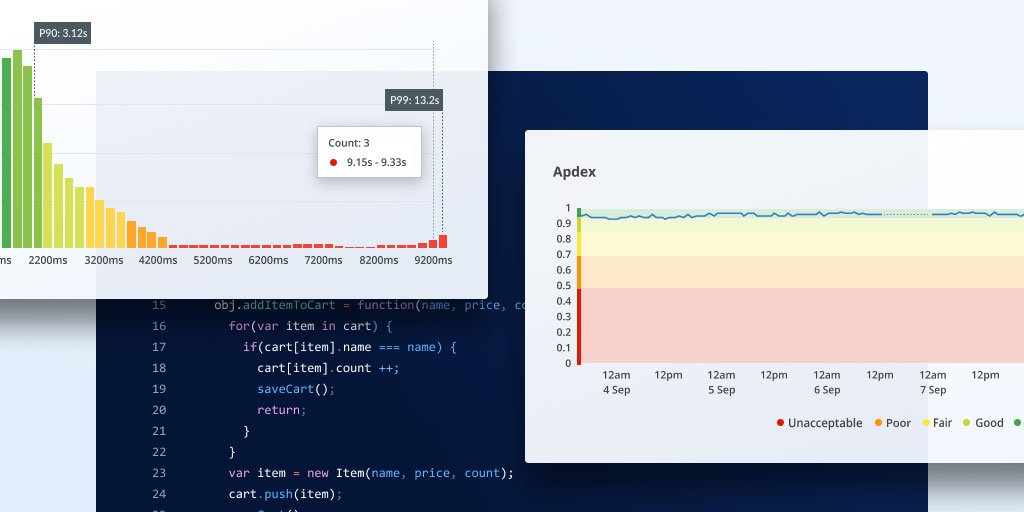
4. Raygun4JS and Raygun APM
Raygun allows you to monitor your React application in the production phase where it’s experienced by end users.
This is important because your end users may still encounter issues that you didn’t discover during the development phase. Raygun gives you code-level insight into each real user session so that you can quickly locate the error occurrence and root cause, and start debugging your code.
With Raygun, you can monitor React applications rendered both on the client and server sides.
React debugging on the client side
For debugging React applications rendered in the browser, you can use the Raygun4JS provider. You only need to add a lightweight script to your page.
Raygun4JS connects your React application to two real-time frontend monitoring tools:
-
a Crash Reporting tool that lets you debug application errors and crashes that have affected your users
-
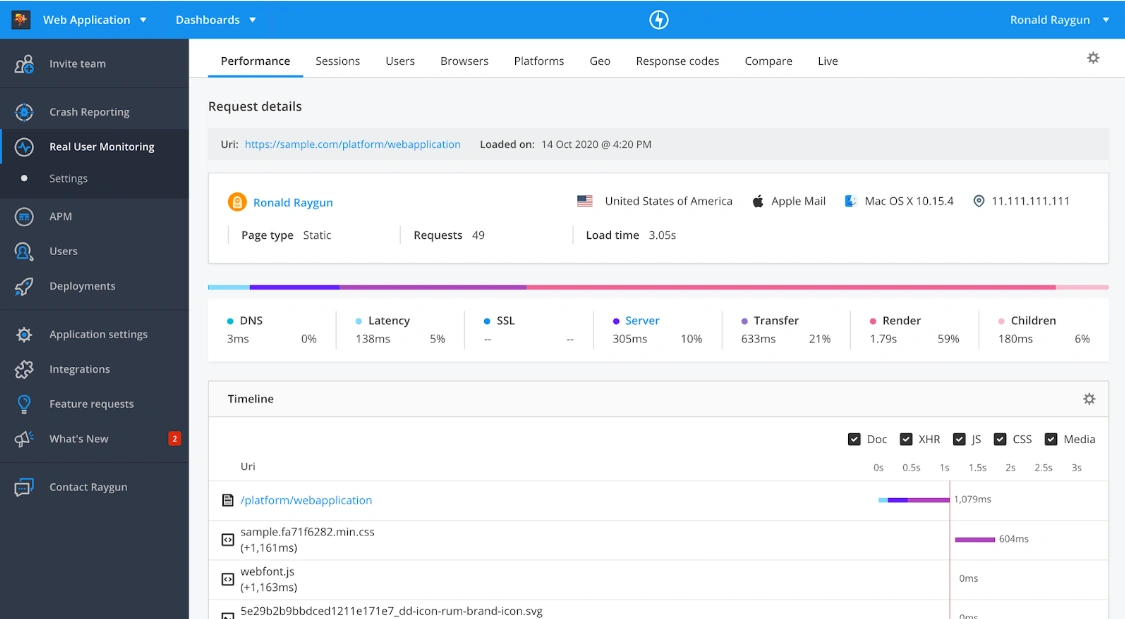
a Real User Monitoring tool that makes it possible to debug complete user sessions — this is also an excellent solution for inspecting frontend performance issues
If you want to monitor mobile applications created with the React Native framework, you can use Raygun’s React Native library instead of Raygun4JS.
React debugging on the server side
For debugging SSR React applications, you can use Raygun Application Performance Monitoring tool, which you can install on your Node.js server.
Raygun APM shows your server-side errors in detail, including the exact line of code, function, database, and API call that relate to the issue. It works with any server-side JavaScript or React library, including Express.js and Next.js.
To learn more about monitoring server-side JavaScript applications, check out our guide on debugging performance issues in Node.js, too.
One of the best things about Raygun is that you can access all three React debugging tools from one integrated dashboard.
Final thoughts on React debugging
To develop and maintain performant React applications, you’ll need to integrate debugging into your workflow, including both the development and production phases.
For the best results, you can use more than one React debugging tool. For instance, you could use VS Code’s JavaScript debugger and React Developer Tools while developing your application and Raygun4JS for identifying and diagnosing React bugs and errors after deployment.
If you get stuck with React debugging or just need a quick fix, you can also use regular JavaScript debugging techniques such as console statements. Following DevOps practices can also help you with setting up and maintaining a general development workflow that can prevent errors, therefore can reduce your debugging workload.
To get started with React monitoring, sign up for a free 14-day Raygun trial to try Real User Monitoring and Application Performance Monitoring.