A complete guide to getting started with the Node debugger
Posted Dec 3, 2019 | 7 min. (1314 words)Diagnosing and finding the root cause of issues is a crucial skill in software development. Software engineers spend the majority of their time reading and understanding existing code. Because of this, knowing how to debug your applications with proficiency will save you time and make you more effective.
In this article, we’ll be looking at the Node.js debugger and some helpful ways you can improve how you debug your own applications. We’ll take a small, straightforward example and demonstrate ways one can easily find issues in code. By the end, you’ll be equipped with enough knowledge to debug your own Node.js applications, as well as possess new techniques you can apply to your particular situation.
What is the Node.js debugger?
If you already have Node.js installed on your machine, go ahead and skip to the next section. Otherwise, let’s get started by installing Node.js. I’m on a Mac and will be using Homebrew for all of the installation steps. To install Node.js, open your terminal and type the following:
brew install nodeThis will take a few minutes, but after the installation is complete, verify that the installation finished correctly by typing this into your terminal
node --versionIf successful, the output should be your currently installed version of Node.js, something like v11.12.0. Just make sure that the version is higher than 6.3.
Debugging a JavaScript file
Our code example is a JavaScript file containing a single function that will add up the sum of two numbers. However, in this example there’s a small bug that the author didn’t catch when writing the code. Create an empty file somewhere on your computer called app.js and paste the contents below into your newly created file.
function doAddition(firstOperand, secondOperand) {
  var result = firstOperand - secondOperand;
  return result;
}

console.assert(doAddition(2, 2) === 4);
Let’s look at this example line by line before we executed it with Node.js. The first line is our function definition which we’ve named doAddition and it takes in two numbers as arguments. Next, lines two and three should add up the two numbers we pass to it and return the sum (eagle-eyed readers may have already found the bug in question). Finally, line six is our assertion that when we add two and two together, the answer is four. If our logic was correct, our application should return nothing, meaning that our logic is sound.
Executing JavaScript files with Node.js is as simple as passing the file to the Node.js runtime. Do that now in your terminal by typing the command below.
node app.jsIf the logic in our code was correct, we should see nothing returned as a result. However, what you will see instead is something along the lines of:
Assertion failedObviously there is a bug in the code somewhere and it’s up to us to find it. In the sections below, we’ll demonstrate some ways using the Node.js debugger to help us find our offending error.
How to use the Node.js debugger
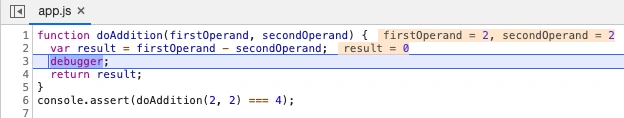
It’s time to get familiar with the Node.js debugger. The simplest way will be to use the built in Node.js client. Before executing this, though, let’s add a debugger statement. In Node.js apps the debugger keyword will add a breakpoint, a stop sign of sorts for your code execution. Let’s add a debugger statement between lines two and three of our app.js file.
function doAddition(firstOperand, secondOperand) {
  var result = firstOperand - secondOperand;
  debugger;
  return result;
}
console.assert(doAddition(2, 2) === 4);
This statement tells the Node.js debugger that when line four is reached, halt the process and give us the opportunity to diagnose our problem. As a next step, we will use Node.js’ out-of process debugging client. Note that this is least feature-rich of the available debuggers, but is useful when simple inspection of our code is sufficient. Start this client by passing the inspect command as an argument to Node.js in the terminal.
node inspect app.jsAfterwards, you will see something along the lines of:
< Debugger listening on ws://127.0.0.1:9229/78a88c51-f5c2-46f8-8187-11c28e7d2694
< For help, see: https://nodejs.org/en/docs/inspector
< Debugger attached.
Break on start in file://app.js:6
  4   return result;
  5 }
> 6 console.assert(doAddition(2, 2) === 4);
  7
As a result, the application is successfully paused on line six. The list of Node.js debugger commands is a short and helpful resource to help us navigate the debugger. We need to continue to our breakpoint on line three, so type the letter c (for continue) in your terminal and press enter. There should now be an arrow pointing to our debugger line. Let’s see if we can figure out our error. Do this by executing our expression and inspecting the value stored in our result variable by typing exec result. The output should be similar to what we see below.
debug> c
break in file://app.js:3
  1 function doAddition(firstOperand, secondOperand) {
  2   var result = firstOperand - secondOperand;
> 3   debugger;
  4   return result;
  5 }
debug> exec result
0
That’s funny, as we were expecting to get a result of four here, not zero. It’s obvious now that the author of this code slipped up and put a minus instead of a plus sign here. Finally, exit the Node.js debugger by typing Control + C twice into the terminal.
Using the Node.js Debugger with Chrome
There are more Node.js debugging features available with the Chrome Developer Tools. Interacting with the debugger in Chrome is similar to the steps above. To get started, simply pass –inspect-brk as an argument to our start command:
node --inspect-brk app.jsAfter that, you should see a line in your terminal that reads Debugger attached. To connect to it, open up Google Chrome and enter about:inspect into the URL bar and press Enter.
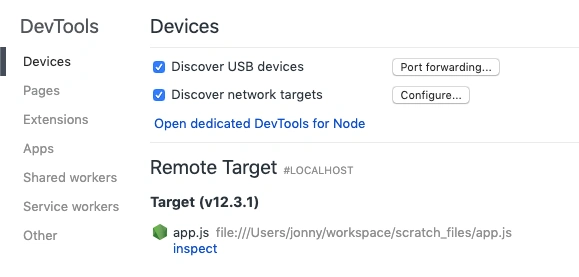
Afterward, you will be redirected to chrome://inspect/ and be presented with a list of available devices to debug. If successful, your screen should show something similar to the image below. Click on the inspect link under the filename, near the Node.js icon to open the debugger.
As a result, we should be debugging our application in a new window. From the popup window, we can execute the same stream of commands by resuming the script execution (F8) to reach our debugger statement. Not only is this more interactive than using our terminal, but our bug is also more obvious thanks to Chrome evaluating our expression for us. There’s a wealth of helpful utilities offered by the Chrome Dev Tools. You can read more about them in the official documentation.
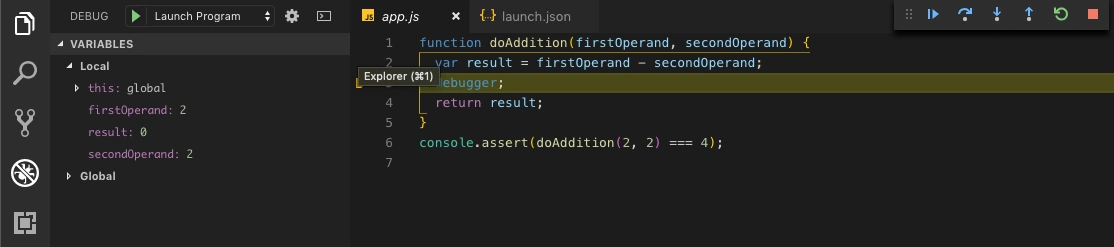
Using the Node.js Debugger with Visual Studio Code
As a final step, we’ll use an IDE to debug your Node.js applications. Visual Studio Code is a popular IDE used by many Node.js developers. You can download and install it here. Open our app.js file with Visual Studio code and on the left-hand side, open the Debug menu (it looks like a (bug getting crossed out). The dropdown in the top left corner should read No Configurations. Click this dropdown and select Add Configurations… > Node.js. This will create a launch.json file containing a default debugging configuration.
After creating the configuration, press the green Play button to the top left. As a result, we’re now debugging our code from within the IDE. Visual Studio Code has plenty of useful things to check out that simplify the debugging process. Read more about them in the official documentation.
Now we’ve covered the basics…
In this article, we’ve covered the basics of connecting to and using the Node.js debugger. Using a small JavaScript application, we demonstrated how to find and identify a bug in our code.
Though this example is limited in scope, the concepts covered can easily be scaled to more complex debugging scenarios.
If your product is suffering from errors in your application, check out Raygun Crash Reporting and take control of the chaos. Crash reporting helps you build more resilient web and mobile applications.