Introducing native support for Core Web Vitals
Posted May 3, 2021 | 5 min. (932 words)In December last year, we released tracking for Core Web Vitals using custom tagging so that you can have consolidated performance metrics that accurately reflect your customer’s digital experience.
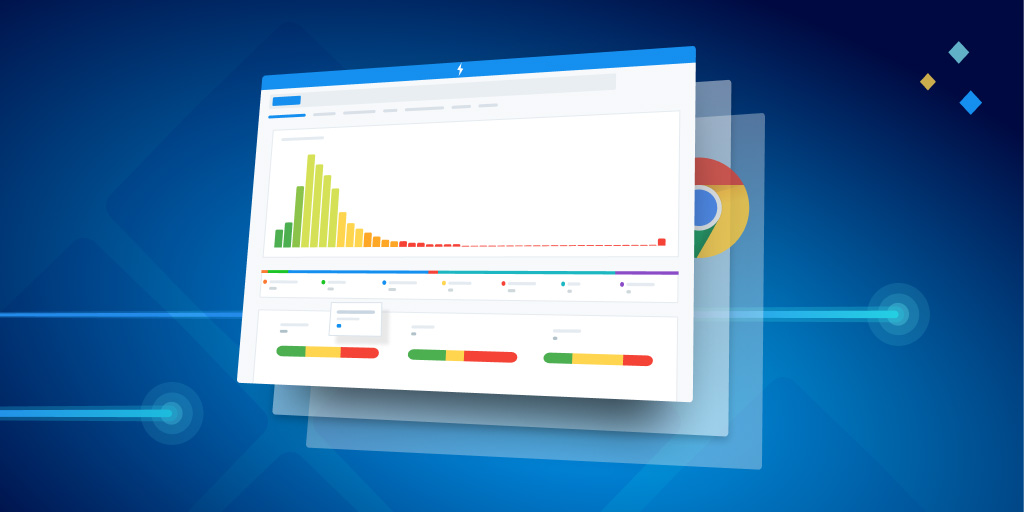
Today, we are excited to continue this journey and announce our native first-class support for Core Web Vitals (CWV) tracking within Real User Monitoring. Now, you can see a detailed overview of how your website performs against Google’s modern user-centric metrics, alongside all the diagnostics you need to take action.
What are Core Web Vitals and why are they important?
Core Web Vitals help you to maintain focus and prioritize activities that will have the biggest impact on your user’s experience. From mid-June 2021, these metrics will be taken into account while ranking your web pages on Google search for mobile devices.
Core Web Vitals are a part of Google’s evaluation of a user’s overall page experience and is comprised of three core metrics:
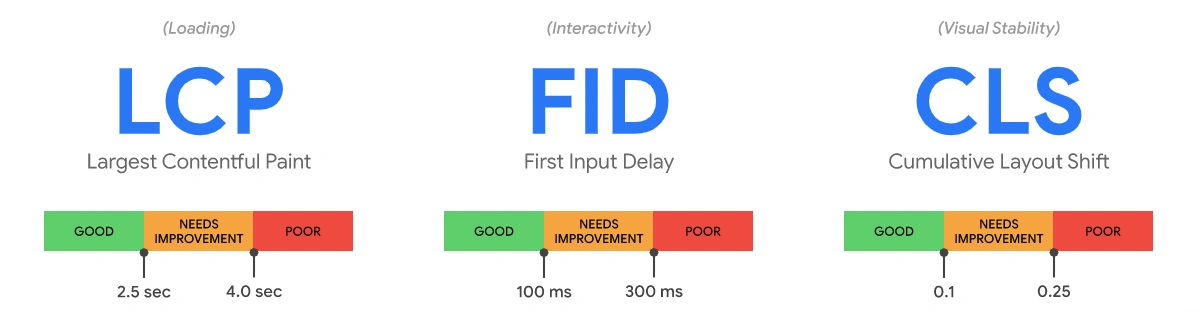
Note: As of March 2024, Google has replaced FID (First Input Delay), the original interactivity metric, with INP (Interaction to Next Paint). Learn about the transition, and what it means for development teams, here.
There are numerous benefits to focusing on Core Web Vitals for your whole team – from the developers’ ability to prioritize and measure optimizations, to improving your Google Search rankings to drive more traffic.
Ultimately, the greatest value of this release comes to your users. Reducing friction and frustration from their digital experience is why these metrics exist in the first place. Ensuring your customers are having flawless digital experiences while interacting with your business is crucial because if your software sucks, your business sucks.
Core Web Vitals in Raygun
Core Web Vitals are an integral part of your performance monitoring tool belt, which is why we’ve baked them directly into Real User Monitoring. Instantly see how your CWV scores are trending across your entire website, and drill into individual pages to focus your efforts on the biggest performance gains.
Surface real user CWV data that you can trust
Unlike traditional tools, Raygun surfaces real field data - not synthetic - meaning you can see how real users experienced your software based on these modern metrics. Having real user data gives you far greater accuracy and assurance than synthetic data can, as these are authentic digital experiences that your customers are having with your website.
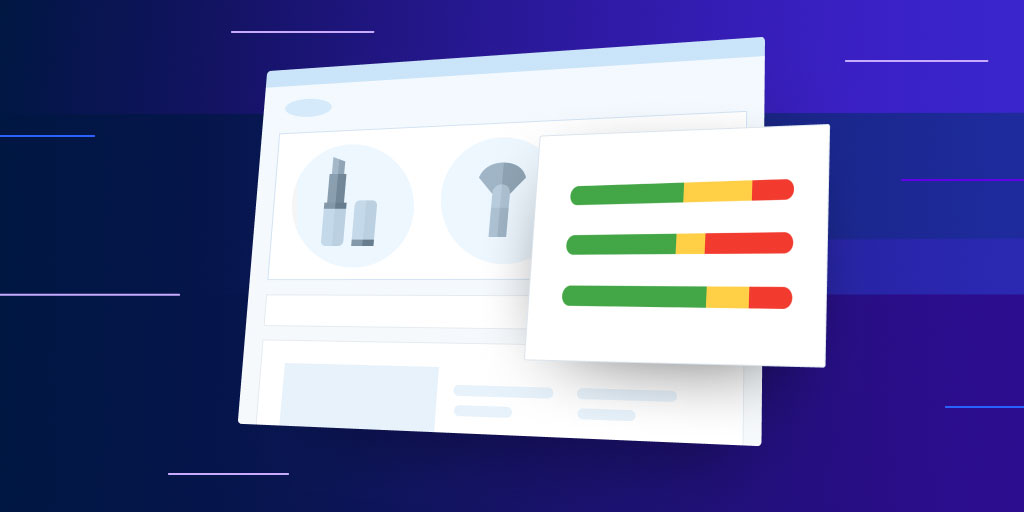
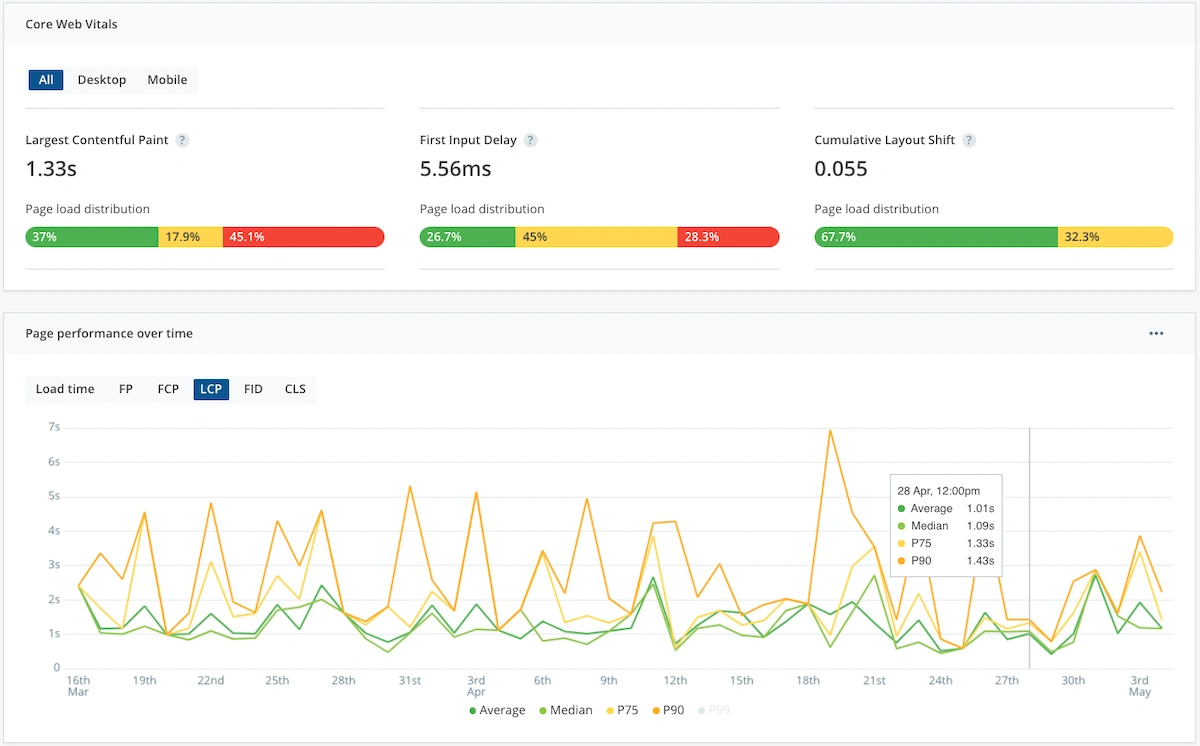
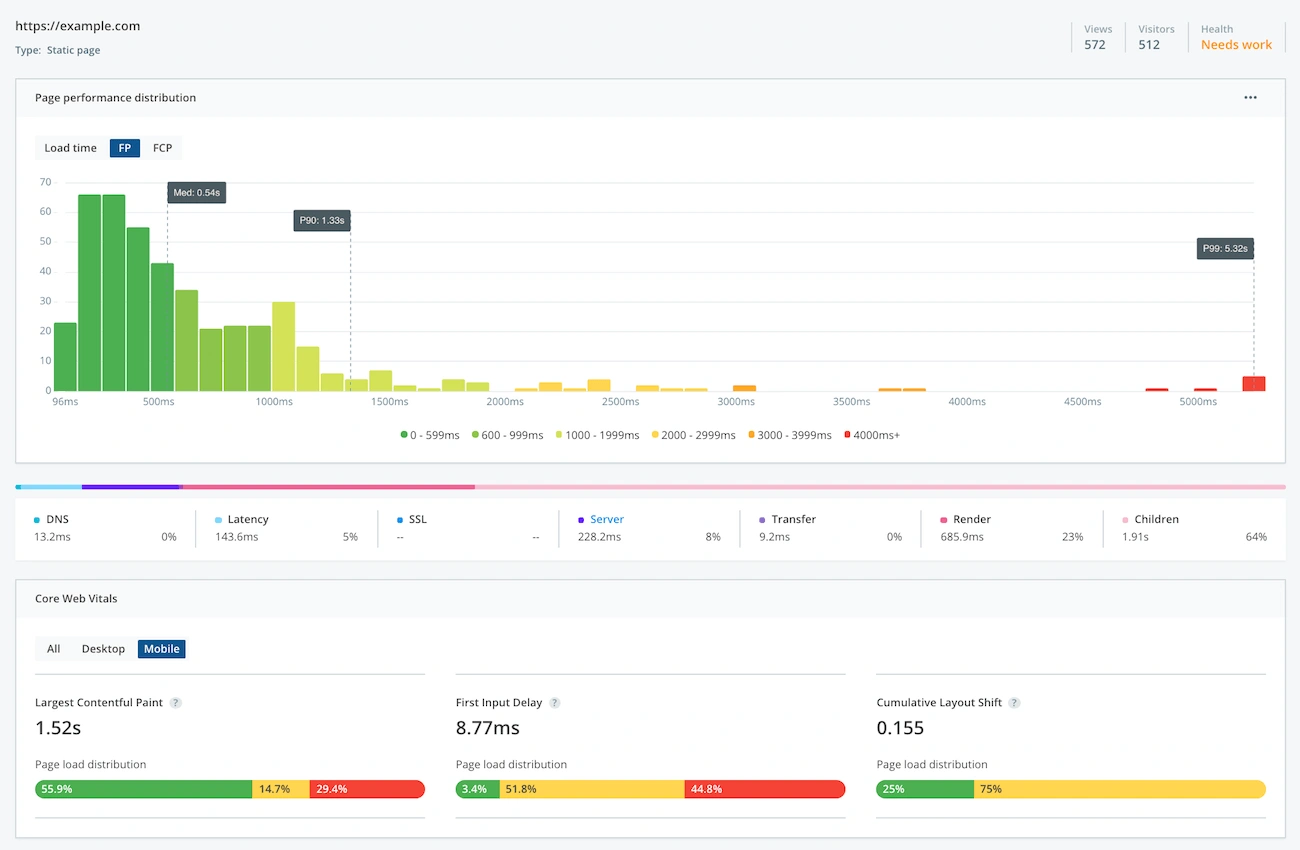
For any given metric to be considered “good” by Google’s standards, 75% of page loads have to be under their threshold (<2.5 LCP, <100ms FID, and <0.1 CLS) in the past 28 days. Use the P75 filter and customizable timeline to see whether a given page reaches Google’s standard of being “good”, and how that performance has changed over time. For a high-level overview, use the average CWV scores as an indicator of your success, and see at a glance the total percentage of users classified as “good”, “needs improvement”, and “poor” with our intuitive traffic light bar.
A month’s worth of real user data has already been gathered on release for existing customers, so you can hop into Raygun and instantly see how your application is performing against these metrics.
Monitor your Core Web Vitals over time
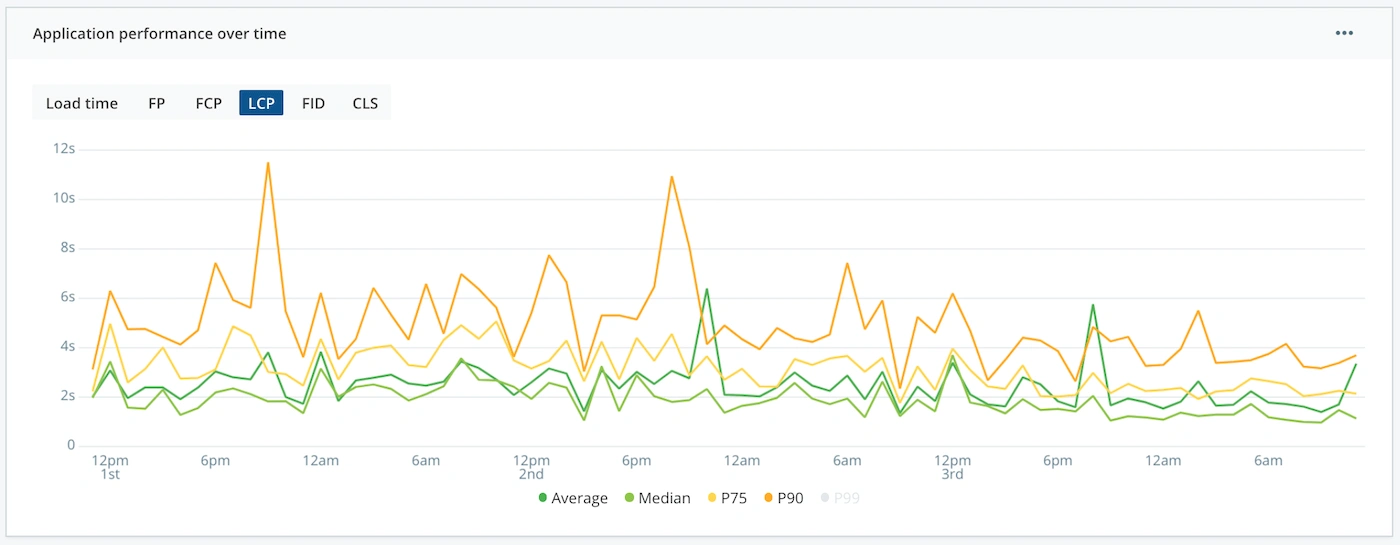
All of today’s modern performance metrics are now accessible directly on the main performance tab in Real User Monitoring. Easily toggle between metrics to quickly identify site-wide issues or track performance wins overtime.
Monitor trends at an individual page level for greater visibility and context into what actions have the biggest impact on your page’s performance so you can learn and optimize quickly to improve your scores.
Filter data by what matters to you most
Focus on the market segments that will have the biggest impact on you and your business with top-level filtering. Select the timeframe that you want to dig into, and filter users by browser, device, geo-location, and more for greater granular detail.
You can also seamlessly toggle between desktop and mobile traffic to see how your scores vary. This functionality is beneficial as your Google Search ranking is only impacted by your CWV performance on mobile devices, meaning you can get an accurate view of how your website performs from Google’s perspective.
Unlock greater context in order to take action
Easily visualize how CWVs correlate against the overall page performance histogram and compare your mean score on each CWV to page load distribution for greater context.
Real User Monitoring doesn’t just give visibility into these metrics; it provides everything you need to take action. Understand exactly how your application performed for every user session with instance-level diagnostics on every page request. Diagnose performance bottlenecks with a full waterfall breakdown of load times across DNS, latency, SSL, server, and transfer times.
Once you have carried out any optimizations to improve the customer experience, you’ll be able to see how these changes have impacted your CWV scores, connecting your activities to outcomes.
Take control of Core Web Vitals
Core Web Vitals are coming in June, whether you’re ready for them or not. Companies who are ahead of the curve and prepare for these changes early will reap the rewards, with improved search rankings, a more efficient development team, and happier customers. Take control of your software and make sure you’re sharpening your competitive edge with Core Web Vitals and Raygun.
Ready to get started? Jump into your Raygun account, head to Real User Monitoring, and drill into any individual page to see it for yourself. If you’re not already using Raygun, sign up for a free 14-day trial. Our usage-based Pricing is fair and flexible, with unlimited users and apps.