Introducing Dashboards and the Raygun software intelligence platform
Posted Mar 31, 2017 | 7 min. (1343 words)When we first created Raygun, we did so to solve our own needs around identifying the root causes of errors in our own software applications. It quickly became apparent that many software development teams had similar issues. We quickly grew into the leading error monitoring service across every major programming language and platform.
Fast forward a few years and we’ve added a vast amount of additional capability for developers to identify not only errors, but also performance issues in their software applications.
It has been a pleasure working alongside our global customer base to build the Raygun application into a tool that developers and their peers count on every day to deliver quality software into the hands of their users.
Our real user monitoring (RUM) functionality has been embraced by Raygun customers at a phenomenal rate. When error and crash reporting data is paired with user session and performance data, things become infinitely more powerful for developer teams. So now we are taking the step to merge all of Raygun’s core capabilities into a single, groundbreaking platform that ensures teams can deliver flawless software experiences for their customers every time.
With Raygun’s software intelligence platform you’ll be given the tools to take your application monitoring to a whole new level. This includes the full release of our new custom Dashboards which will allow your whole team to get a detailed overview of your application’s health.
We encourage you to maximise the full Raygun platform’s capability and gain deeper insights into the health and end user experience of your team’s software.
The full benefits of the Raygun platform including the new Dashboard
As part of the Raygun platform, you’ll also have access to our latest features designed to give you a better understanding of your overall software health – from errors and crashes to performance problems affecting your end users. Having the data is only part of the puzzle – you need it presented in an easy to use and customizable format.
For this, we have rolled out a new look for our Dashboard:
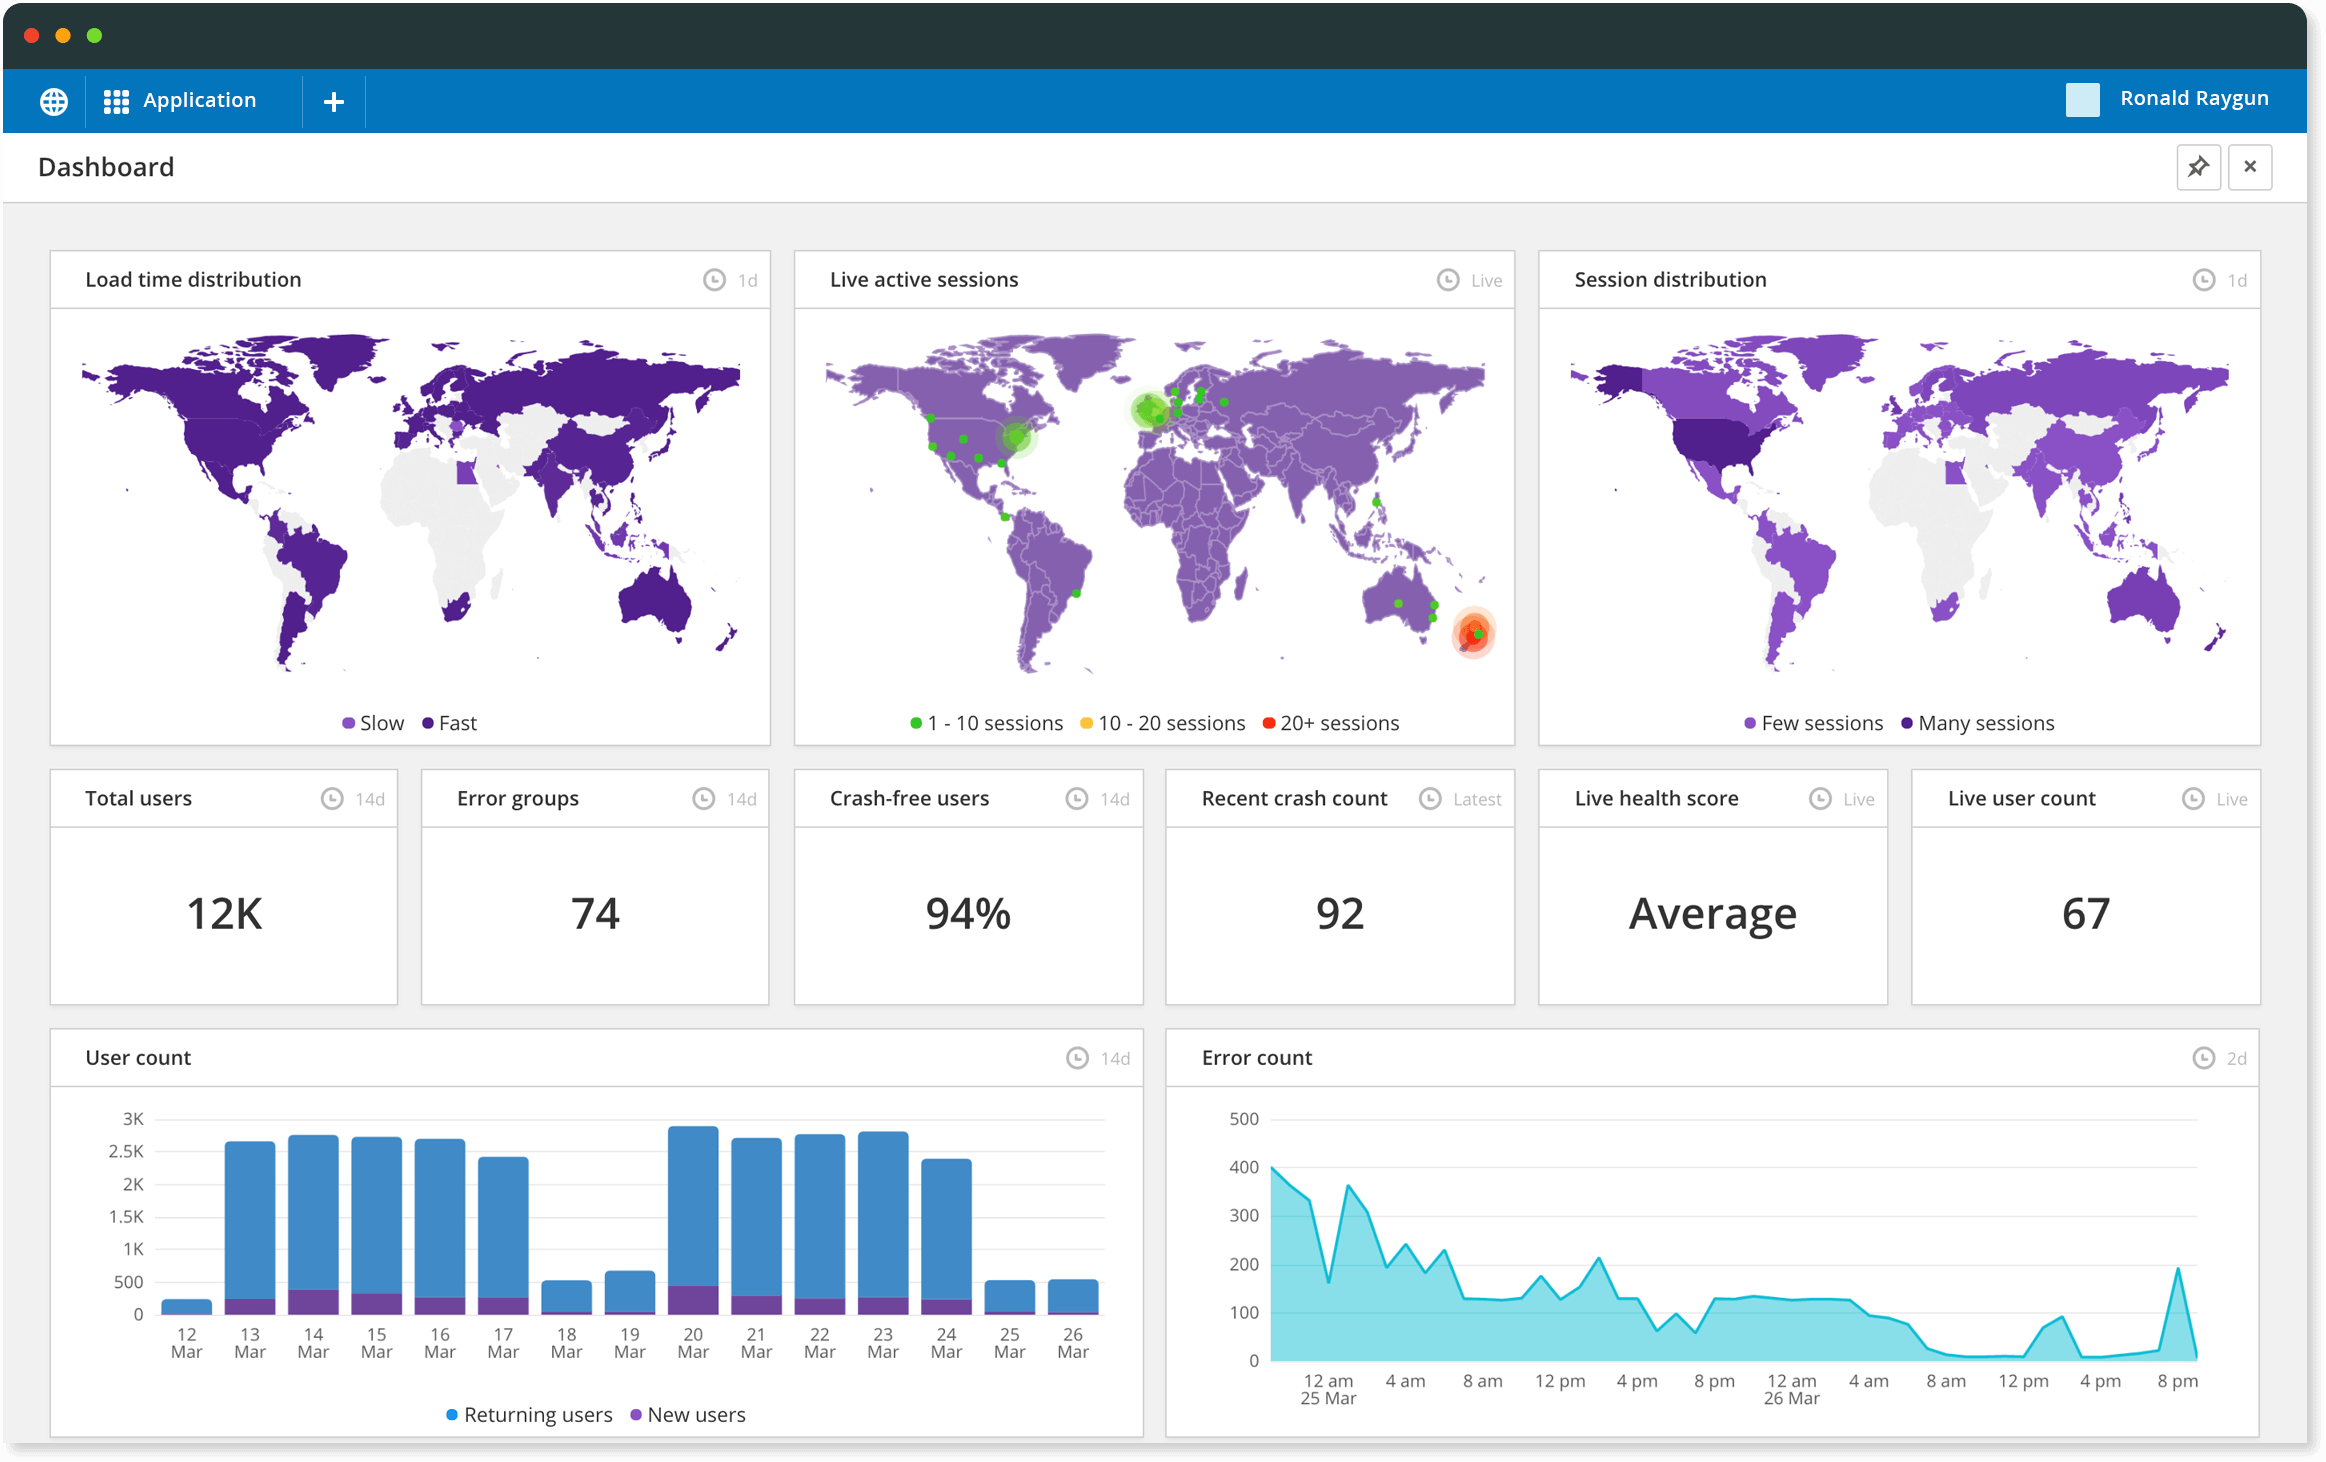
After being in beta for over a month, we are pleased to announce Dashboards V1. Thanks to everyone who gave us feedback – we read every note and took all your suggestions on board. We built the Dashboard with our diverse customer base in mind – making the data display highly customizable and easy to use is our first priority. For this reason, the Dashboard has the following core functions:
Tiles
Tiles are at the core of the Dashboard and represent the different data points available for crash reporting, real user monitoring and platform level data. We will be releasing more tiles created from your feedback in beta and V1. We’d love to hear from you – head to our feature request forum to request more. Drag and drop individual tiles to display only the metrics you need. You can also customize the data inside the tiles to show specific time ranges or error groups:
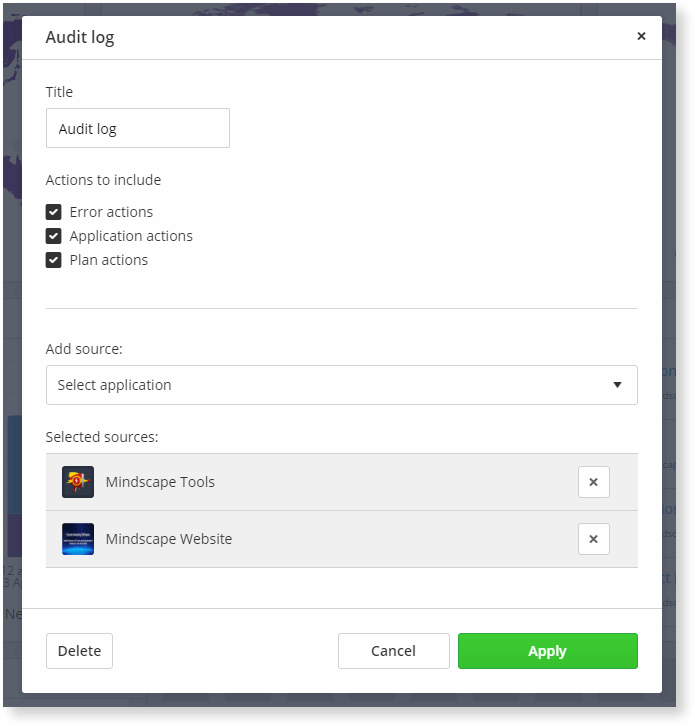
The audit log settings showing how to customize a tile
Tile templates will be on their way soon to help you arrange tiles to show specific data, but in the meantime head to this blog post for some inspiration on arranging your tiles. Filtering options will also be available soon, allowing you to create filters around whether you have marked an error ‘Active’, ‘Resolved’ or ‘Permanently Ignored.’
TV mode
Presenting your data on a screen for everyone to see is a great way to rally your development team around a certain KPI. Want to resolve more errors for your end users than last month? Keep your most important data points front of mind by presenting your data in an attractive UI. (Watch this space for a TV DarkMode.)
The TV mode also works for mobile too. Pin the header, so when you have more tiles you can have an unobstructed view of the Dashboard.
Multiple Dashboards
The amount of Dashboards you can create will depend on your plan type. With the multiple Dashboards different teams will be able to see different Dashboard views. For example your backend development team may want to see a live crash data, while your management team can create a Dashboard with higher level metrics such as amount of new users and location information.
Why platform capability is infinitely more powerful
Errors and crash reporting software is only one aspect of the Raygun platform as we see it today. Now, user tracking, real user monitoring, deployment tracking and more work together within one platform to give you a complete picture of your application’s health. This data is often siloed between tools that teams use. Raygun brings it all together. The result is magical.
Crash reporting and real user monitoring are certainly powerful tools on their own. However, using them together becomes exponentially more valuable when creating high quality software. Most of our customers do so.
With these new monitoring innovations, developers gain unrivalled insights into their applications with full visibility across their entire technology stack. Each and every bug or performance problem within an organization’s software application can be brought into the view of the entire developer team with pin-point accuracy.
Those who only want to monitor their apps for errors or crashes are missing out on a whole new level of insights into how their users are experiencing their application.
Updates to platform pricing
Raygun gives companies the confidence that users experience their software the way it was intended. In order to do this, we believe our customers need as much information about how their software is performing so companies can proactively improve their own software experience. Software intelligence is key to providing the best possible user experience.
Because we believe so strongly in software intelligence, we want all Raygun customers to have access to all of our products. With the Raygun Platform, data is shared in the backend across all of our services, this further unlocks valuable information about errors that are occurring, who is being affected and how issues can be resolved. Without this interconnected data, customers are missing out on valuable information that will ultimately save businesses time and money. It’s a no brainer – more is better.
To do this means we want to move away from selling individual products and sell Raygun as a Platform. Once you’re on the Raygun Platform, you’ll have access to all of our services now as well as new services released in the future.
How will it work?
Historically Raygun pricing has been based on processed events. This has worked well in the past, as we are effectively oncharging our processing costs to the customer. With the shift to the Raygun Platform, we want to try to accommodate the smaller businesses who have more financial restrictions as well as our larger customers who have significant event volume. To do this we’re offering three pricing options. At a high level, these plans break down as follows:
Startup: 250,000 events/month, unlimited apps, five users, unlimited integrations and 14 day data retention.
Small Business: Unlimited events, unlimited apps, 40 users, unlimited integrations, 60 days data retention, and up to five custom Dashboards.
Enterprise: Unlimited events, unlimited apps, 100 users, unlimited integrations, 180+ days data retention, and unlimited custom Dashboards.
For more information on per plan features for the Raygun Platform, see our pricing page.
For our existing Raygun customers
We are grateful to our existing Raygun customers for your support and continued feedback. Changes to the services you use can sometimes be of concern, but we’d like to reinforce there is no impact on day one for existing customers.
We are committed to making this fair and easy for everyone, and can assure you there will be no immediate impact on your plan or price.
We’ll be in touch with everyone over the next several months to discuss the changes and options moving forward. If you are interested in moving to the Raygun Platform plan immediately, or have any questions or concerns at all, please get in touch with our friendly team here.