Improving MTTR: Resolve incidents faster through better ops, alerts and docs
Posted Jan 19, 2022 | 8 min. (1669 words)When downtime strikes any distributed software deployment or platform, it’s all hands on deck until the lights are green and service is restored. This process, from the recognition of a problem to a deployed solution, has most commonly been defined as MTTR — mean time to resolution.
In just the last few years, site reliability (SRE) and DevOps professionals have developed sophisticated new models for how they work and audit their successes. In 2022, MTTR is one of the most widely-used software performance success metrics. Most DevOps teams are asked to set quarterly or annual OKRs that require them to continuously improve their alerting workflows, resolution playbooks, process documentation, and internal communication to reduce MTTR.
The reasoning is sound — the longer the MTTR, the greater the impact on the organization, whether in cost, risk, or diminished trust from customers or partners. But any organization that relies on software to run their business needs to fully understand MTTR, including its faults and caveats, to make informed decisions about their monitoring solution and the intelligent alerting they build into their response workflows.
What is MTTR?
MTTR, or mean time to resolution, is a measurement of the average timeframe between detecting an incident and deploying a fix, plus any tests or processes in place to prevent it from happening again.
The R in MTTR moonlights under a few other definitions, which is a major reason why it’s one of the most misunderstood terms in software monitoring and operations.
-
Mean time to recover: The average time between the beginning of the incident and restoring the system to full function.
-
Mean time to respond: The average time between detection (via alerting) and restoring the system to full function.
-
Mean time to repair: The average time between starting repairs and restoring the system to full function.
These distinctions are enormously important when developing processes around MTTR or investigating a monitoring solution. If one member of your team is measuring resolution and another repair, you’ll likely end up with very different values.
Software-driven businesses use MTTR as a general measure of the availability of their systems, which establishes the cost of operating and sustaining their services and platforms. These costs include physical/digital assets, the people required to maintain uptime and how they can use their expertise, and even ongoing relationships with existing customers.
- Service level agreements (SLAs): SLAs are contracts between internal teams or a service provider and client, and require robust monitoring for enforcement.
- Customer success: Those responsible for managing relationships with ongoing customers, particularly in business to business (B2B) and enterprise environments, are unquestionably invested in the volume and duration of customer-facing incidents and outages.
- Application performance monitoring solutions: Some organizations use MTTR to measure the efficacy of the tools they use to detect incidents to begin with. If their current solution doesn’t provide them with the right features, such as alerting workflows and proactive detection of incidents, to reduce MTTR, it might be time to migrate.
How is MTTR measured?
Let’s use an example. You’re part of a SaaS company that provides a web application that other businesses use as part of their mission-critical workflows. You’re heavily focused on maximizing your platform’s uptime and software performance to ensure your customers have a productive experience.
A domain name system (DNS) outage affects your customers’ ability to access your application. A DevOps engineer or SRE quickly notices the outage on their application monitoring dashboards. This moment of detection marks the beginning of the incident.
The team member quickly edits your platform’s DNS settings to route to a backup provider. In other definitions of MTTR, like mean time to respond, the timer stops here, but mean time to resolution also includes the effort required to prevent the issue from happening again.
In the case of this DNS issue, the resolution might include adding a new DNS-specific chart to a commonly-used dashboard, updating internal documentation on the process of manually migrating to the backup, or creating a new script to handle that migration automatically when the monitoring solution detects a DNS outage.
For the sake of calculating MTTR, the timer now stops.
Calculating MTTR
In the example below, there are 18 incidents in 90 days. Each is represented as the time between detecting the incident and restoring full function and creating new processes to prevent it from happening again.
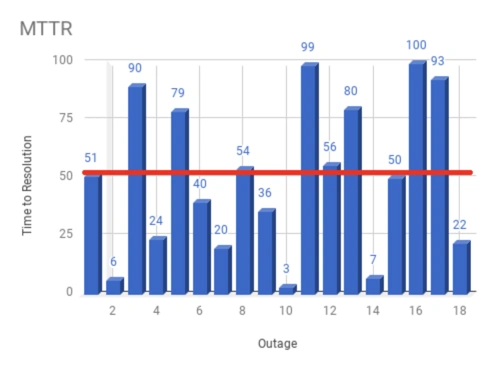
The MTTR calculation is the total time spent on all incidents divided by the frequency of incidents in a given timeframe. So, given 18 incidents over a 90-day period:
MTTR = sum of time to resolution for all incidents / number of incidents
 MTTR = 918 minutes / 18 incidents
 MTTR = 51 minutes
While MTTR is a commonly-used metric for software-driven organizations, it’s also a statistical value with limitations in representing complex technical and human challenges.
- MTTR doesn’t reflect when or how often incidents happen. Your team can have an MTTR of 2 minutes, but if there’s a customer-facing incident every hour, you’re still looking at enormous opportunity cost or lost trust with the people who use your service regularly. Similarly, incidents that happen at night might not affect your operations as severely.
- MTTR also doesn’t reflect widely varied issues and resolutions. If your team deals with smaller incidents most of the time, like the DNS outage issue mentioned above, your MTTR might not accurately reflect your team’s ability to tackle large issues, like database corruption.
How to improve MTTR
Every software-driven organization should invest in improving their MTTR, but first, they need to start measuring it and creating a company culture that’s invested in the ongoing health of that number and the implications it has for company operations and customer experience.
If measuring MTTR isn’t part of your team’s processes yet, the best way to get started is to automate logging incidents with an application performance monitoring (APM) solution or use alerting workflows as initial timestamps. Avoid manual processes at all costs, as you want your skilled people focused on resolving the incident (thus lowering your MTTR!), not worrying about whether they properly updated an internal spreadsheet.
If you’re already measuring MTTR, improving it involves a combination of technical and cultural approaches.
Proactive detection and mission-critical Alerting workflows
Your team can only work as quickly as your software performance monitoring solution can notify them about new incidents. Real-time, customizable dashboards for mission-critical physical/digital assets are a must-have to help passively identify issues, but the DevOps/SRE industry is quickly headed toward proactive solutions.
For example, Raygun’s Alerting, which works with its Crash Reporting and Real User Monitoring products, simplifies the process of creating new alerts for mission-critical conditions, even if they haven’t occurred yet.
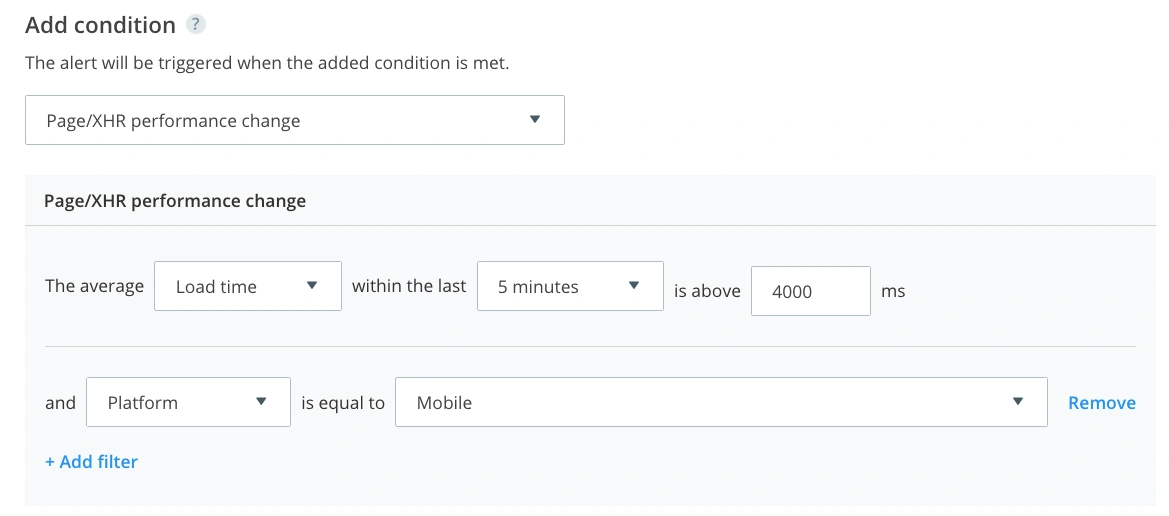
Raygun triggers alerts based on specific conditions, custom thresholds, and filters, and automatically assigns resolution to specific team members. For example, you can proactively set an alerting workflow for a mission-critical error, like a shopping cart that refuses to finish your customers’ transactions. Once you group all known shopping cart errors under the same tag, you can use that tag as the condition for the alert and automatically notify the frontend team about the issue.
Once the email hits their inbox, members of this team can jump straight into Raygun and start their root cause analysis (RCA) and begin the resolution process.
By minimizing the lag between the start of an incident, automatic detection from your application monitoring solution, and notifying the most relevant people, you can make significant headway toward improving your MTTR.
Detailed documentation
Development, DevOps, and SRE teams can best reduce their mean time to resolution when they have a single source of truth for how their systems and platforms should operate. A common documentation strategy is runbooks, which explain the process of remedying a known issue that’s been seen in the past.
Detailed documentation like runbooks help teams understand what led to a particular incident, how they could prevent it in the future, and better prepare themselves to deal with errors and outages that they haven’t seen before. For example, documentation on manually moving to a backup DNS would be helpful if both the primary and backup DNS providers happen to fail simultaneously.
And if the process of creating documentation doesn’t come naturally, one productive strategy is performing a blameless postmortem for every incident. This session results in better documentation of the incident in question, how/where/when/why it happened, and the steps used to resolve it. When done correctly, blameless postmortems educate stakeholders and encourage a culture of continuous improvement.
Efficient operational practices
Finally, the operations teams responsible for discovering and bringing an incident to resolution need the flexibility and autonomy to work quickly and deploy fixes. Here are some modern strategies for reducing MTTR through operations:
- Establishing a culture of continuous improvement, in which each team member has the ongoing drive to reduce the volume and span of incidents through collaboration and clear communication.
- Creating trust between employees and management so that the operations experts can craft novel solutions to new and ongoing problems without needing sign-off from an obtrusive number of stakeholders.
- Using MTTR in combination with other metrics to tell a more holistic story of application and software performance. You may also want to track a metric like mean time between failures (MTBF) to understand how often incidents occur.
- Implementing best practices from Site Reliability Engineering — a Google-developed operational playbook for improving DevOps, which includes processes like practical alerting, effective troubleshooting, and valuable postmortems.
Remember that improving mean time to resolution isn’t about relentlessly chasing a number in the short-term. Instead, invest in new tools that promote proactive alerting workflows based on real-time software performance metrics. Set your team up for success with processes that continuously improve your approach to resolving incidents. Stay focused on delivering the best possible customer experience.
If you follow these principles—not premature optimization, which leads to alert fatigue and overworked DevOps teams who miss the forest for the trees—you’ll start to make an impact on your MTTR while implementing even more valuable system changes throughout your organization and its applications.