Four powerful Alerting workflows
Posted Nov 23, 2021 | 7 min. (1308 words)Since its release last month, Alerting has quickly ingrained itself into the incident response workflow at some of the most technically advanced companies in the world. We’re here to empower your team to do the same. In this blog, we’ll run through four common alerts that you can implement today to ensure you’re maximizing the full potential of Alerting.
If this is the first you’re hearing of Raygun Alerting and would like to learn more about what it is and how it works, I recommend reading the launch blog before revisiting this workflow guide.
Otherwise, if you’re ready to go, let’s just jump right into it!
Alert 1: Influx in error count
One of the most common use cases for Alerting is when you want to know if there is an influx of errors introduced into your application(s). We recommend implementing an alert such as this across all applications, as it’s the most effective way to quickly detect whether a widespread issue has recently been introduced.
This alert will trigger regardless of the error/error type that caused the influx, with a focus on the scale rather than the severity of errors.
How to get setup:
This blog will look specifically at how to set up the conditions, thresholds, and filters for your alerts. For more information about Alerting best practices, you can visit the launch blog.
To get started, select the ‘Error instance occurs’ condition. This will ensure that you receive notifications whenever one or more instances of an error occur within a specified interval.
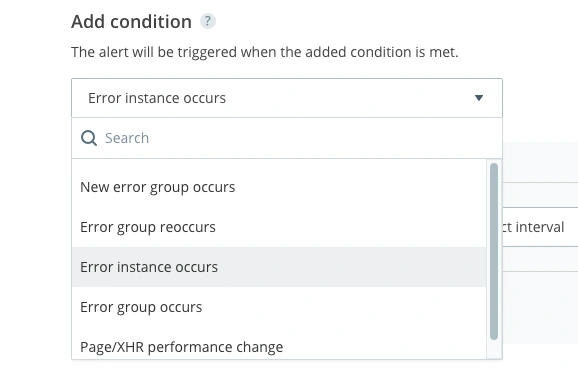
Next, you’ll need to select what threshold of errors will trigger the alert. You can set your alert to be triggered by a defined number of errors in 1 minute, 5 minutes, 10 minutes, or 30 minutes. This is true across all alert types in this list.
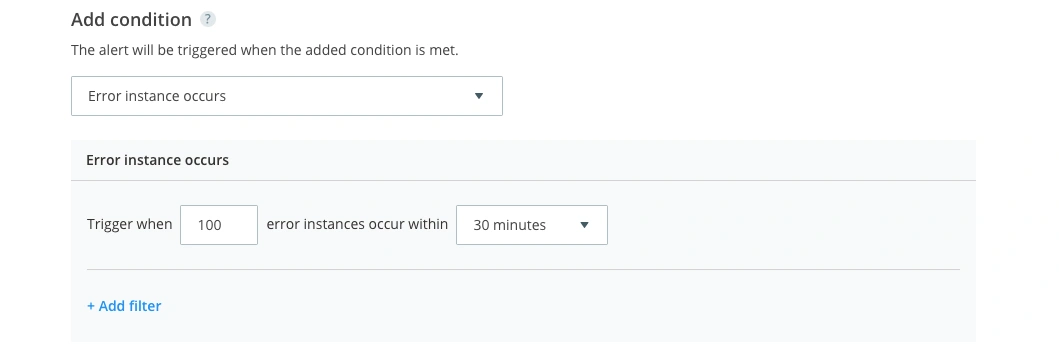
We suggest setting a threshold that significantly deviates from your usual error frequency. This will vary depending on the size and complexity of your application, and the regular volatility in error count. If you usually receive 100 errors per day, for example, you might want to set up an alert for when there are 100 errors in 30 minutes.
Alert 2: Mission-critical error
Have you ever experienced a mission-critical error that you never want to see again? Is there a particular area of your application where your business can’t afford to have errors? Without monitoring, finding one specific error in a plethora of metrics can be like trying to find a very sharp and painful needle in an ever-expanding haystack, letting it do far more damage than it ever needed to. Well, now you can set up an alert to sound the alarm if the reaper is back in town.
How to get setup:
By selecting the ‘Error group occurs’ condition, you’ll be able to receive alerts about specific error groups.
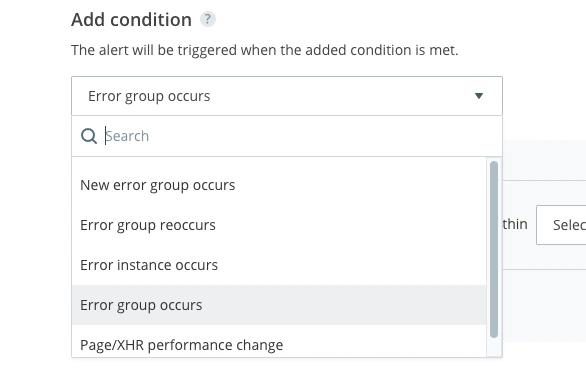
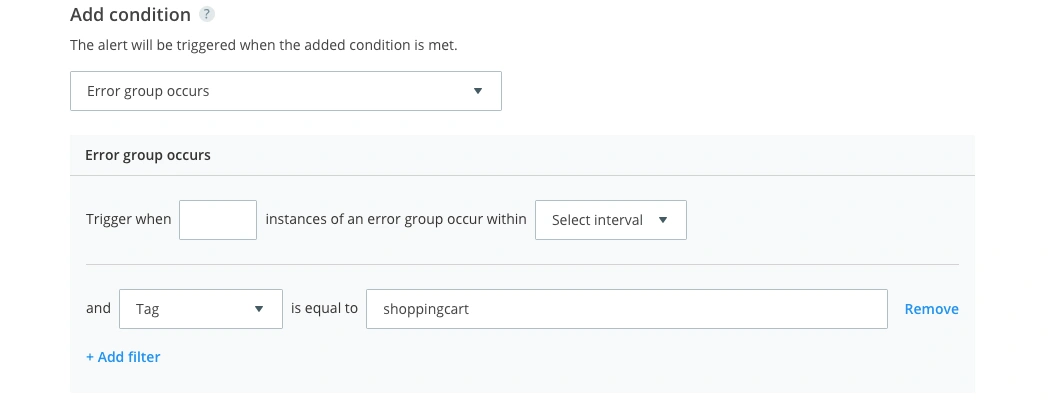
Much like the surge in error count, you still have the ability to set thresholds, but this isn’t necessary for this example. Instead, it will notify you when a specific error shows up in your application even if it only occurs once, which removes the need for a threshold.
This alert type will require you to add a custom tag to your most high severity issues. For this example, we are wanting to be alerted whenever there is an error in the shopping cart. To identify whenever this happens, we have filtered by the ‘shoppingcart’ tag, which we have already applied to all known shopping cart error groups. This tag is interchangeable with whatever you deem to be a ‘critical’ error.
A single crucial error can be the breaking point that impacts revenue and causes your users to seek an alternative solution. Prioritizing and quickly eliminating mission-critical issues in your software is vital for creating superior user experiences, and delivering on business objectives.
Alert 3: Surge in frontend performance
This alert is for all of our frontend developers who need to know when the load time of their website surges. Imagine you’ve just introduced a new homepage – the design is beautiful, the content has all been updated, you think it might even be your best work yet, but there’s one big problem… it’s extremely slow for your end-users. So much so, that they can’t even see the amazing work that your team has done behind the curtains of the loading symbol before bouncing.
It’s not uncommon for slow performance to fly under the radar. Often, testing is done in a local environment where a page loads extremely efficiently but isn’t necessarily representative of your real user’s experience. By setting up an alert for whenever the performance of your website dips, you can have peace of mind that your users are consistently having a smooth experience.
How to get setup:
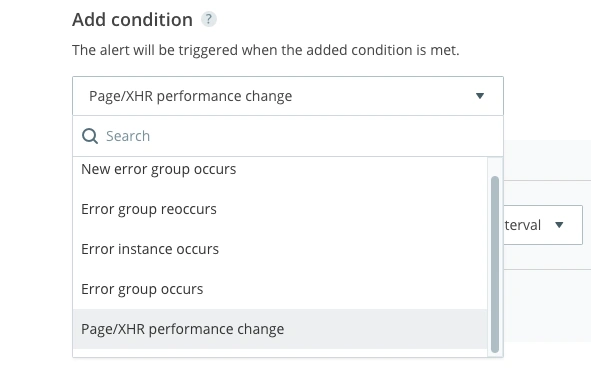
To create a performance alert, select the ‘Page/XHR performance change’ condition.
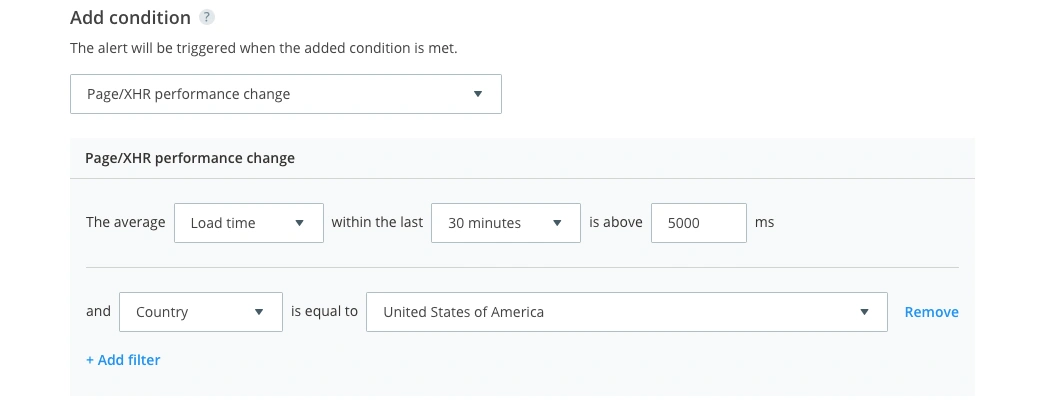
To detect when there is a general surge in the performance of your website, select the ‘Load time’ metric. This is the most universal performance metric to build an alert around. Regardless of how much traffic your website gets, we suggest selecting a time interval of 30 minutes. By setting the threshold to a larger time frame, you will stop it from triggering when only a small handful of users have slow experiences. This will give you a greater set of data to base your alert (which is expected due to external factors such as internet connection).
For this example, we’re going to tie this alert specifically to the USA. There are a couple of major reasons that we have decided to do this. The first is that our customers are primarily based in the USA, so naturally we want to optimize our website for them. The second is that the average load time varies from country to country. A good load time in America (where the average internet connection speed is ~26.7Mbit/s) is going to differ from a good load time in somewhere such as India, where the average internet connection speed is ~8.1Mbit/s. Depending on where the majority of your traffic is coming from, this can significantly skew your average load time.
Alert 4: New issues introduced into your application
After using Raygun for a while, you’ll get familiar with certain frequent error groups, but what happens when a new release introduces a host of issues you’ve not encountered before? Good news – you can set up an alert for that too!
How to get setup:
By selecting the ‘New error group occurs’ condition, you’ll receive notifications whenever a new type of error group occurs on your selected applications. Raygun uses a grouping hasher that reads different parts of an error instance in order to group them together. There are different grouping methods available to suit your application’s error reporting patterns.
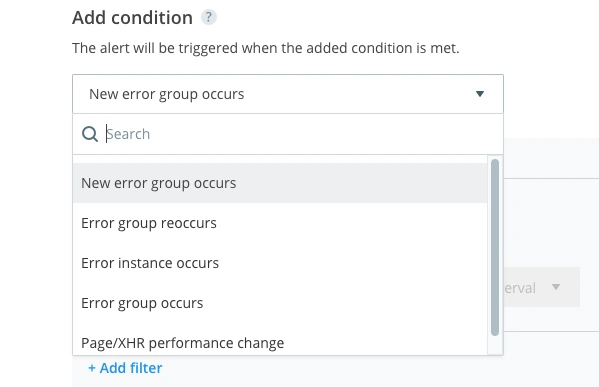
This is the final and most basic alert on our list, as you don’t need to set a threshold for it to trigger, but don’t underestimate how powerful it can be. To create this alert, you simply need to select ‘New error group occurs’, and you’re ready to go. By leaving the ‘Set threshold’ checkbox unticked, you’ll be alerted to any new error group that has been introduced into your application.
Wrapping up
The versatility of Alerting has empowered development teams to get greater visibility into issues emerging in their software. Hopefully, you’ve found these alert examples useful and are able to implement them into your own application.
It’s still early days for this functionality, so we’d love to hear how you’re using Alerting too! Email us your favorite alert that has been implemented into your own workflow and we’ll send you a free Raygun t-shirt.
If you would like to try Alerting for yourself but don’t have a Raygun plan, you can sign up for a free 14-day trial. Pricing is flexible and usage-based, with Alerting included on every plan.