Drill into your website’s sessions with Pulse real user monitoring
Posted Oct 30, 2015 | 3 min. (455 words)Raygun real user monitoring provides a rich display of your user’s sessions as they navigate your web site or app. In this post I’ll give a quick walkthrough of the data that you can expect, and how it can aid in diagnostics and analysis of how your site performs – in real time.
List of all user sessions
The Sessions tab gives you a high-level overview of the sessions within the currently selected time range. At the top of the tab are metrics including the count of sessions, count of users, and the median duration of the sessions. Below that you get a grid of the actual sessions, including data on the user, their country, the duration, view count, and the last visited page for that session.
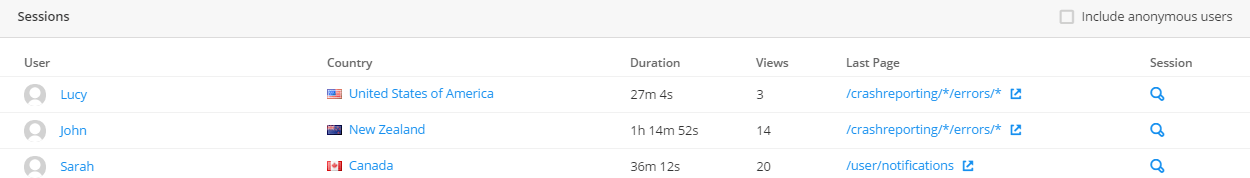
You’ll also note the magnifying glass out the right-hand side, which lets you drill into a particular session.
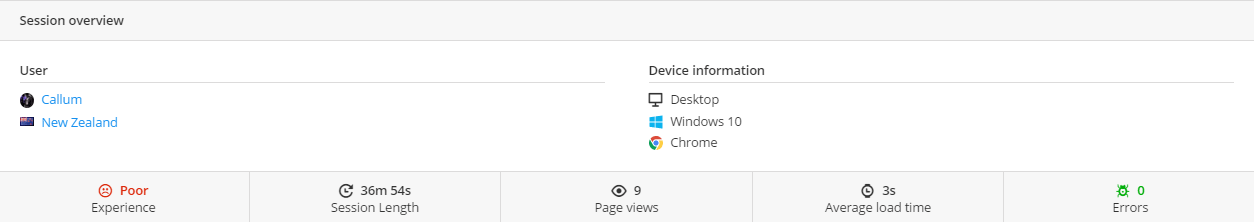
Session view
Inside the session view you get metadata about the actual session, including environment data for where it came from (OS, browser and device type). You also get more detailed timing information including the average load time, error count (if you’ve integrated Crash Reporting) and the user’s ‘experience’, which is a measure of load time.
Next up is the session timeline, which is where the magic happens.
Timeline
A really cool feature in Pulse is the Session Timeline, which shows you what pages the user visited over time, and the timing data for each. Here’s what it looks like:
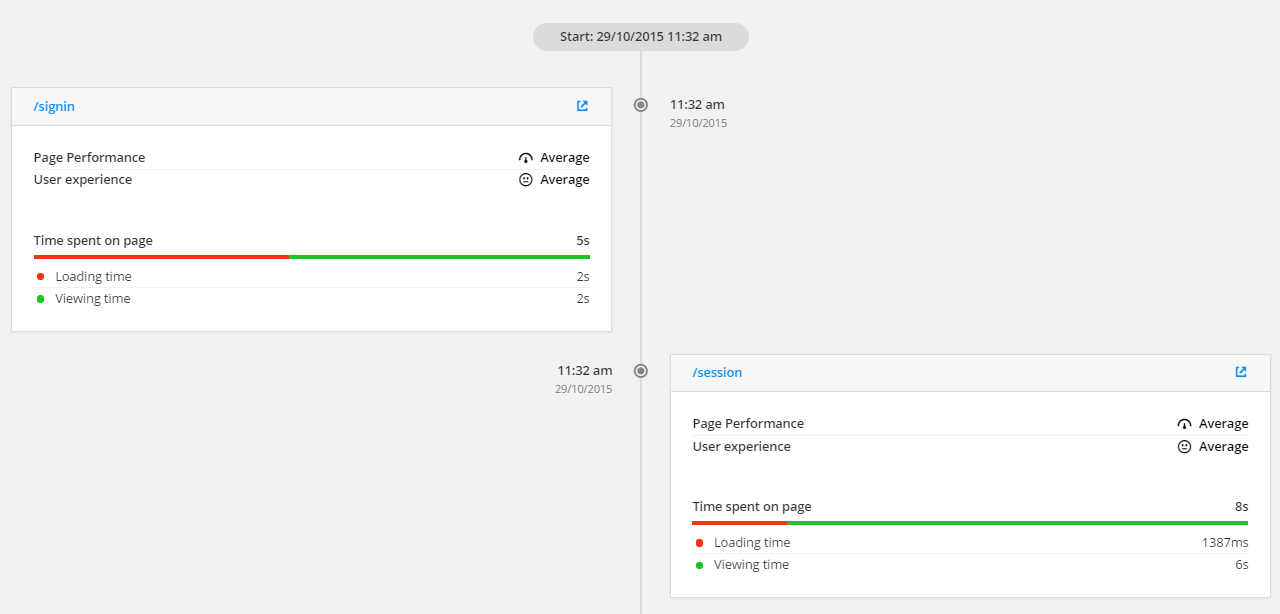
The image above is for Raygun and is the beginning of the actual session where I took the screenshots for this post. As you can see, I visited Raygun’s /signin route at 11:32am, spent 5s logging in including load time, then was redirected to a /session route. Listed for all of them are performance and experience metrics along with load and viewing times. When a user’s session ends you’ll also see an ‘end’ timestamp at the bottom of the page.
This is the heart of Pulse’s real user monitoring, which allows you to trace back the actions a user took as they navigate your site. Invaluable for customer support, debugging and operational intelligence.
See your own site’s data with Pulse now
Integrating the above is easy – there’s a wizard in the app which walks you through the steps, and it’ll only take a few minutes to see the above data for your own website. If you’ve got Raygun Crash Reporting simply log in and activate Pulse real user monitoring for one of your applications, or if you need an account you can start your free 14-day trial of Raygun here, no credit card needed.
** UPDATE **
Real User Monitoring for Mobile Applications is here! See the update here