.NET Debugging: 6 techniques you need in your arsenal
Posted Jul 31, 2019 | 9 min. (1776 words)Debugging. It’s one of the most time-consuming ways of finding a bug.
As a senior .NET developer, I can tell you that it’s best to avoid the necessity for debugging altogether by writing clean code that’s covered by automated tests. If you’re a senior developer yourself, you probably already know this. And if you’re a junior developer, now you know it too!
However, the world isn’t binary. There’s a lot of gray between the white and black that people usually like to see.
Maybe you have a third-party system that’s not behaving as expected. Perhaps you have production data that doesn’t quite match what was specified. Simply put, we’re talking about highly complex tasks, and it’s impossible to think about every edge case, even when you do have automated testing in place.
The following techniques are some of the more advanced ones I use when the need arises to actually do some .NET debugging.
Tip 1: Use object exporter
During debugging, it’s often necessary to inspect the current object instances. Visual Studio supports the DebuggerDisplay attribute, which allows you to specify a special display of the object’s contents in the debugger.
While this can be helpful, it’s also a lot of effort to add these attributes to all relevant classes. Also, it still might not contain the information that you need in a specific debugging situation.
If it’s just a simple object, that’s not really a problem. Just expand it and inspect the properties.
However, if you’re working with arrays, this becomes tedious very quickly. Oftentimes, it’s necessary to find a specific set of elements in the array. The Visual Studio debugger does support LINQ in general, but there are a lot of problems that make this a frustrating experience. The LINQ namespaces aren’t always in scope, so it’s necessary to use the static methods syntax instead of the extension methods syntax. Or the debugger just displays an error because it can’t evaluate the expression for different reasons.
So sometimes, it would be nice to just dump the complete object into a plain text format.
That’s what Object Exporter is for. It’s a Visual Studio extension, and you can install it manually from the Visual Studio Marketplace. Or you can install it from within Visual Studio via Tools -> Extensions and Updates. Please make sure that you select Online in the tree view to the left before you search for the extension.
It can export an object in different formats, namely JSON, XML, and C#. It’s also possible to export custom expressions. This is very helpful if you just want to export a subtree of an object graph.
This export can then easily be searched, simplifying inspection of complex object instances. You can also easily store it, for example, as an input for automated tests or simply to compare it with results from a future debugging session.
Please be aware that Object Exporter currently doesn’t support VS 2019.
Tip 2: Load PDB With ReSharper
Have you ever gotten an exception inside a third-party library that you were using and couldn’t figure out why this exception occurred?
And to top it off, was it a closed-source library without a PDB file, making it so you couldn’t step into the code of the library? If so, you probably thought, “Now what?” A simple solution is to let ReSharper create the PDB file for you. ReSharper is also a Visual Studio extension, but unlike Object Exporter, ReSharper is a commercial extension.
To let ReSharper create the PDF file, you need to open the Modules window via Debug -> Windows -> Modules. Then, locate the assembly that you want to generate the PDB file for and right-click on it.
Select the option Load Symbols with ReSharper Decompiler:
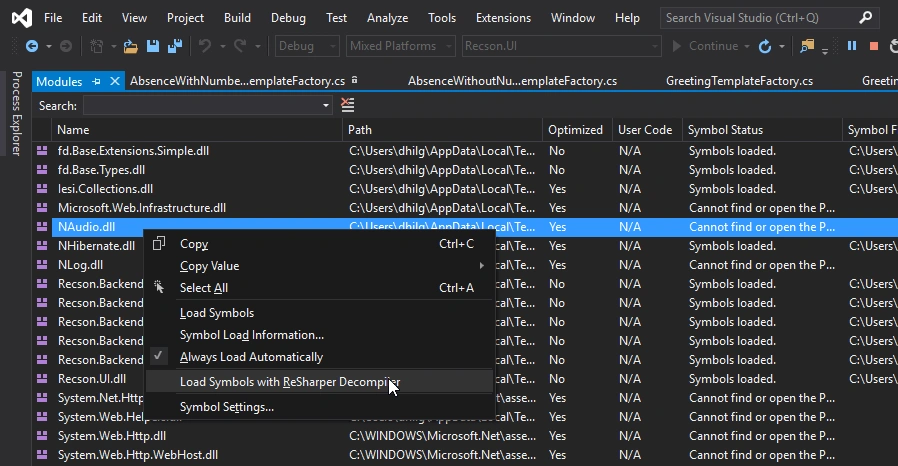
Depending on the size of the assembly, it can take up to a few minutes for the PDB to be generated and loaded. There will be no visual indication of this process in the Modules window. If you’re wondering what’s happening, you can open the PDB Generation Status window via ReSharper -> Windows:
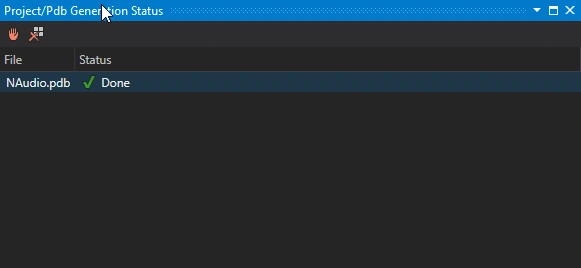
Please be aware that the Modules window might not update once the PDB file has been loaded, so it’ll continue to show Cannot find or open the PDB file, even though the file was loaded.
Once the PDB has been loaded, you can navigate the assembly’s source code and even set breakpoints in it. The source code you’re seeing isn’t original. Instead, it’s a reconstructed interpretation of the assembly’s IL code. So this solution comes with the drawbacks that decompilation has: constructs that can’t be correctly decompiled, as well as verbose and sometimes unnecessarily complex code. Still, this is a helpful feature of ReSharper, and it’s solved quite a few debugging challenges for me in the past.
Tip 3: Use ,nse to evaluate an expression without side effects
During debugging, you need to evaluate expressions all the time. As long as these expressions don’t change the state of the system, all is fine.
However, oftentimes, evaluating an expression causes a side effect.
For example, if you’re evaluating a property with lazy initialization, it’ll actually initialize that property in the context of the debugged code. This can lead to strange problems during debugging. I remember one particular debugging session where this led me on an hours-long investigation into an entirely unrelated and wrong direction.
Had I just known the following little tip back then!
To prevent side effects when evaluating an expression, simply append , nse to it. So if you want to watch o.MyProperty, add the following to the Watch window:
o.MyProperty, nse
This will execute the expression in a special sandbox, preventing any changes to the state of the debugged application.
See the following demonstration for an example of how to use , nse:
Tip 4: Freeze multithreaded applications
Next on our list of .NET debugging tips, we’re going to talk about multi-threaded applications.
Debugging multi-threaded applications can be a real pain, especially if multiple threads are executing the same code. Breakpoints will be hit by each thread, and single-stepping will switch between threads. It’s very easy to lose orientation and concentration like this. Wouldn’t it be great if it were possible to tell Visual Studio that you want to debug just this one thread and not switch to other threads that are currently executing the same code?
Well, turns out, there is a way to do this.
Open the Threads window via Debug -> Windows -> Threads. This window shows all threads of the current application. Double-clicking a thread switches to it. Right-clicking a thread shows different options, one of which is Freeze:
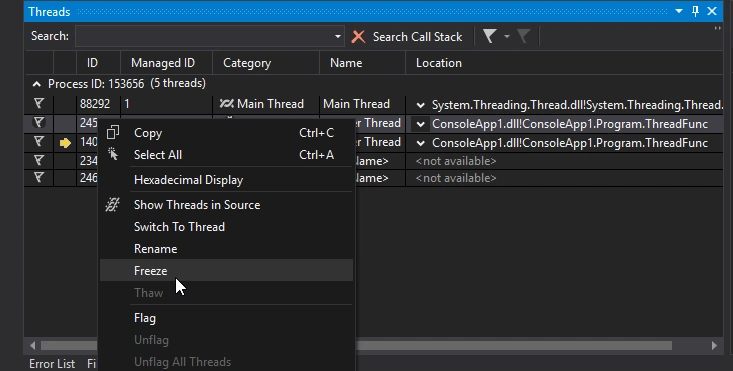
As the name suggests, this freezes the execution of that particular thread. To use this feature in our scenario, you can set a breakpoint at the beginning of the code that you want to debug.
When the breakpoint is hit, use the Threads window to freeze all threads for the current location except one. You can now debug this one thread and single-step through the code without thread switches interrupting your concentration. You can also set breakpoints and be sure they’ll be hit for the correct thread.
If you want to continue running the program after you’ve debugged the code in the thread, you should unfreeze—or Thaw—the other threads so they can perform their work as well.
Tip 5: Use Object ID
Object IDs are a feature of the Visual Studio Debugger that has several helpful use cases.
One such use case is that object IDs basically allow you to make a certain object instance globally available during debugging. This lets you compare it to other instances at a code location where the instance wouldn’t be available otherwise.
Another use case is to compare object identities. Imagine a scenario where you’re debugging an app that uses a dependency injection container. This app contains two classes that are receiving an instance of a service class via their constructors. The service instance resembles the way by which the two classes can communicate with each other. However, this coordination doesn’t work for some reason. One reason for this issue could be that the two classes aren’t receiving the same instance of the service class.
Object ID can easily identify this issue.
To use it, add a breakpoint at the constructors of the two classes. When the breakpoint gets hit in the first class, right-click the service instance in the Locals window and choose Make Object ID. When the breakpoint in the second class gets hit, check if the instance shows the object ID. If so, they’re the exact same instance.
If not, they’re different instances, and you’ve found the reason for the bug: a problem with the DI container’s configuration.
Tip 6: Make sure you’re getting stack traces
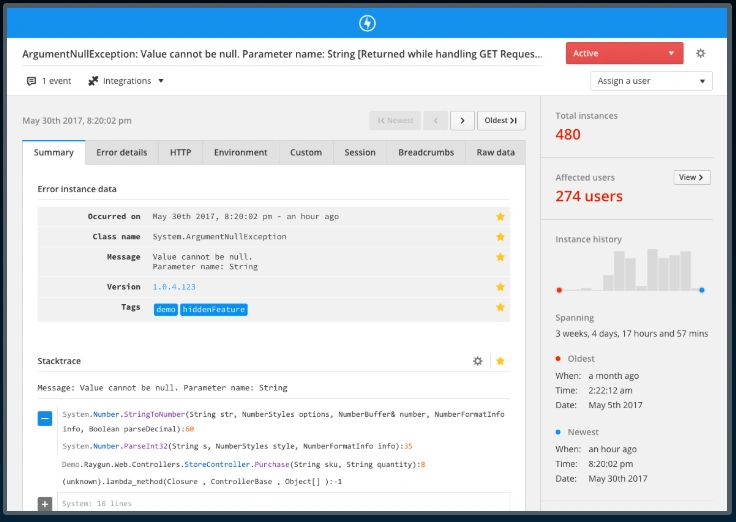
If you’re lucky and the bug in your system surfaces as an exception and not just as an incorrect value somewhere, a stack trace is the simplest way to get started with your debugging. It pinpoints the problematic location and how it was reached. This usually leads to rather quick results, so the last tip I have for you is to make sure that you’re getting these stack traces.
And there’s actually a lot that can prevent this!
First of all, when you catch an exception and rethrow it, never ever use throw ex;. Instead, use throw; . The first variant loses the original stack trace and therefore masks the original error location.
Second, always log all unexpected exceptions with full details. The easiest way to do this is to simply call ToString() on the exception. This will include the stack trace.
And third and finally, ensure that you have easy access to these logs. It’s a bad idea to keep logs only in files on the server, as oftentimes we developers won’t have direct access to production systems, especially in established corporations. Also, flat log files are rather hard to analyze.
The solution to these problems is an error monitoring service like Raygun, which your application writes the errors to. It’s responsible for collecting error logs from all of your applications in one central place. It also allows you to group, filter, search, and analyze the exceptions in a simple way. And you can do all of that without having to ask anyone for access to the production servers.
Conclusion
Debugging is a necessary part of every developer’s work. I hope that you now feel stocked with some good debugging tools for .NET applications. I suggest you try the outlined techniques today and familiarize yourself with them. I’m sure this will improve the productivity of your next debugging session. And maybe it’ll even be a little bit more fun!