How to debug Android Chrome from Windows, Linux, or Mac
Posted Jan 6, 2021 | 8 min. (1586 words)Testing and debugging websites and web apps on mobile devices can be challenging. Browsers on phones and tablets often don’t have built-in debuggers, and emulating mobile devices is never as accurate as you’d like. To debug mobile websites on Android, the desktop version of Chrome provides a solution with remote debugging.
This article will show you how to use remote debugging with Chrome from your computer. You can use one of the common desktop operating systems like Windows, macOS, or Linux.
How to debug Android Chrome
If you think you might have a bug in a mobile website or a native app on Android but can’t quite pin it down, Raygun supports JavaScript crash reporting as well as Android crash reporting. You can take a free 14-day trial here.
Setting up
Before you can do any remote debugging, you need to set up your computer to be able to recognize your Android device. This means to allow Chrome’s debugger to recognize and attach to the phone. You will start by setting some options on the phone.
Phone settings
Open up the Settings app on your phone. You’ll need to enable Developer options if you haven’t already. To do this, go to the “About Phone” menu, which is located inside the System menu on modern Android devices. Once you’re in there, scroll to the bottom and tap on “Build Number” seven times. Now, go back to the previous screen or into the “System” menu in the Settings app. There, you’ll now find a new menu item named “Developer options” near the bottom.
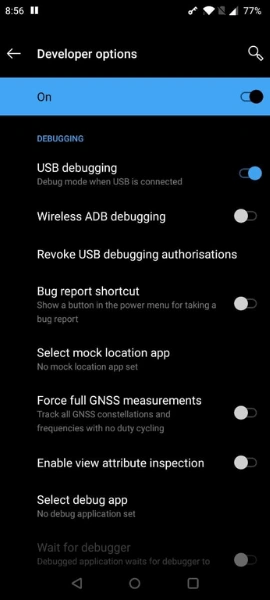
Once you’re inside Developer options, enable them on your phone by clicking the toggle at the top of the page. When the toggle says “On”, scroll down a bit and enable “USB debugging” as well. This will allow you to debug your device via a USB cable connection.
Computer setup (using Android USB debugging)
Driver installation
That’s all we can do on the phone, for now, so let’s get our computer ready. The steps to undertake are slightly different on each of the big operating systems.
If you’re using Windows the first thing you’ll need to do is install the USB drivers for your device. The Android Studio website has a list of places to find the drivers along with some instructions on how to install the drivers on your computer. Some manufacturers provide links to a driver file. Others just lead you to a support website, in which case you’ll need to do a bit of searching to find the drivers for your device.
In case your computer runs macOS or Linux you won’t need to install drivers. Mac users are in fact ready to go. If your machine runs Linux, there are some more setup steps required. You need to make sure your user account belongs to a certain group and you’ll need to install a package with so called “udev rules”. They are configurations that make certain USB devices known to your Linux computer. If you’re interested in more details, I’ve written a dedicated article on the Linux setup for ADB a while ago.
Install Android Debug Bridge (ADB)
Once you’ve got the drivers or udev rules installed, you’ll also need ADB, which provides an interface to talk to your mobile device. ADB and other Android platform tools come with Android Studio, but you can also download them separately.
Either using Android Studio’s embedded Android SDK or the official platform tools package from Google are the preferred ways to go. The platform tools packages are just .zip-files containing a folder platform-tools. After extracting the files you’ll find binaries such as adb.exe (Windows) or adb (macOS and Linux) in there. You can then execute them as necessary from a shell or terminal window of your choice.
If you are on Windows and want the most minimal version of ADB without any fluff, have a look at the XDA Forums; scroll down to Downloads heading and click the first link in that section.
After it’s downloaded, run it to install ADB. Once it’s installed, you’ll need to navigate to the folder where it was installed (C:\Program Files(x86)\Minimal ADB and Fastboot by default) and double-click cmd-here.exe. This will open a command prompt window in that folder.
Using either of the techniques, in your shell window, type in adb start-server to start the ADB server.
Note: The ADB server will need to be running anytime you wish to debug. If you restart your computer, the server will not be running automatically. It’s not recommended to run ADB as a permanent background service.
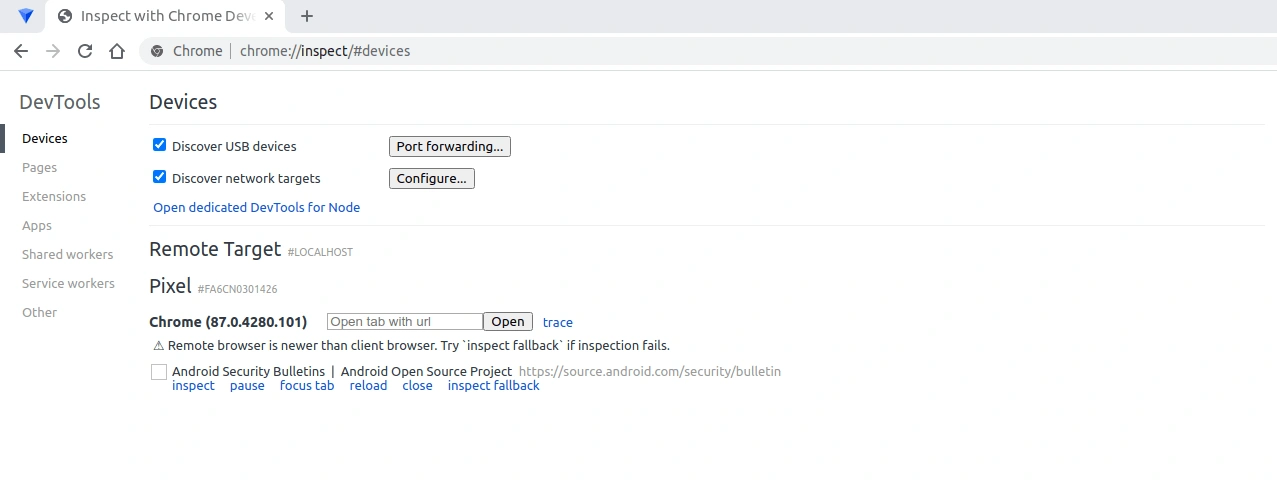
The last thing we need to do to set up the computer is to enable remote debugging in the Chrome developer tools. To do this, open up Chrome on your computer and go to the DevTools settings at chrome://inspect/#devices
To debug websites in Android from here, make sure “Discover USB devices” is checked. I’d also suggest to keep this section of the developer tools open in a tab because we’ll need it again soon.
Making the connection
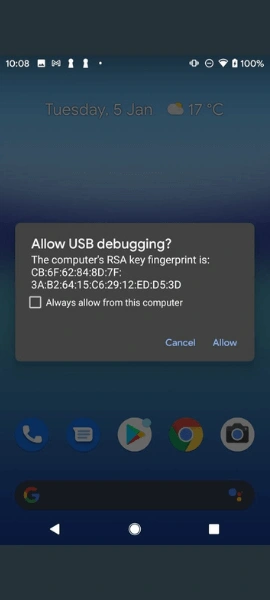
That’s as far as you can get with either device on its own. To debug websites in Android on the device, we’ll need to hook them up together. If you haven’t already, plug your phone into your computer via USB. If you didn’t do this as part of the driver installation, you might see a notification on your taskbar letting you know your computer is setting up your new device. Make sure your phone is on and unlocked. If it is and the ADB server is running, you should see a popup titled “Allow USB debugging?”.
If it doesn’t show up, look in your notification area on your Android device. If it says “Connected as a media device”, something like that, or something about “MTP”, click on it. That should bring you to a screen that allows you to choose a different connection type. For our purpose “Camera (PTP)” is the appropriate connection type. Once you’ve selected PTP, the “Allow USB debugging?” popup should come up.
To avoid having to deal with this popup every time you connect your device, check the “Always allow from this computer” option. Either way, you’ll want to click “OK”, which will let your mobile device be visible to your computer for debugging. At this point, go back to the DevTools tab we looked at earlier. If everything went well, you should see your phone and all its Chrome tabs listed on there now.
Debug websites running in Chrome on your device
Now it’s time to stop getting set up and start debugging! Finally! Chrome on your computer should show you a list of tabs open in the Chrome browser on your remote device. If the tab you want to debug isn’t the active tab, you can click on “focus tab” to make it the active tab on the device. Then click the “inspect” link.
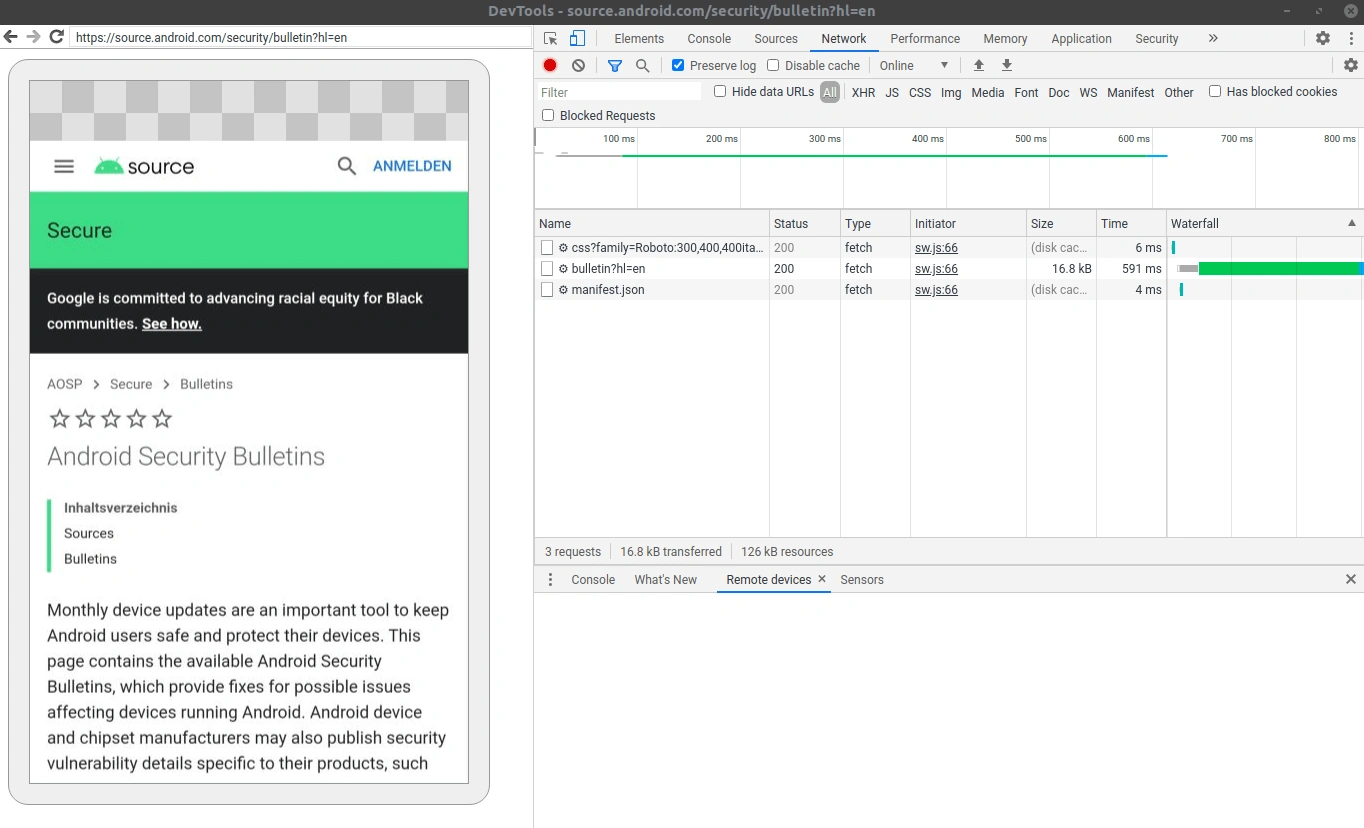
This will bring up the inspector for that tab. From here, you can use Chrome’s developer tools pretty much like you would if you were debugging a web page in your desktop browser. You’re even able to see your device’s screen within the developer tools. If it isn’t already showing, or if you’d like to toggle it off, click the icon right next to the inspector icon in the top left corner of the developer tools.
Debugging tips
You can also control your device from your developer tools. Use your mouse cursor on the screen cast as if your cursor was a finger on the device itself.
- Click to tap
- Click and drag to swipe
- Use your scroll wheel to scroll
- Hold
Shiftwhile dragging up to zoom in - Hold
Shiftwhile dragging down to zoom out
You may notice that there are some transparent spots in the screen cast. These are UI elements from the Chrome app or from your device’s system UI. They are hidden because the remote debugging protocol only allows you to interact with the web page itself.
On older and less powerful devices the screen cast uses a lot of your mobile device’s processing power. You might notice the performance seems slow while you are screen casting. Thus, if you’re trying to measure performance, disable the screen cast and interact directly with the mobile device.
Finally, if you run into issues where nothing happens when you interact with your device, try closing the Chrome app and reopening it. You’ll need to re-connect to the remote device via the DevTools screen in the developer tools. If that doesn’t help, go through this quick checklist:
- Unplug the device and plug it back in
- Lock your phone and wake it back up
- Close the developer tools window and reopen it again.
Conclusion
Debugging mobile websites in Android Chrome doesn’t have to be difficult. It may take a bit more setup than most of us would like. But, once that’s taken care of, debugging a mobile web page on the device becomes much simpler. You can now debug Android mobile websites on a real physical device.
Did you spend too much time discovering your bug in the first place? Raygun helps you detect, diagnose, and destroy errors in your JavaScript or Android code. Smart alerts and error grouping means you never miss a bug in your app again. Read more about Android crash reporting and JavaScript crash reporting.
More on debugging Android
How to architect your errors for better error reporting
Getting started with Raygun Crash Reporting using Raygun4Android