Are high asset loading times killing your website performance? Here are the critical asset load paths you need to know
Posted Oct 29, 2017 | 7 min. (1362 words)Websites can be fickle beasts. At any point during the website’s development cycle, page load times can creep higher, even if you haven’t done anything to cause a slow loading page. One of the culprits is a high asset loading time. But how do you spot slow loading assets, and give your users back their precious time?
Use the tips below to make analyzing and improving performance bottlenecks easier and faster. Users will notice your website loading quicker, even if technically they might not be loading faster at all.
**How is that possible? **
Well, if we reduce the number of critical resources and bytes required for the initial render, users can start viewing your website while the rest of it loads, which improves the UX dramatically.
Terminology: what do I mean by critical resources, rendering and asset loading?
Critical resources
Critical resources refer to the minimum number of assets a browser has to download before it can render a page for the first time. These assets block the rendering of a page, so keep the number of assets low so that browser can render the page as quickly as possible.
Critical bytes
Critical bytes are the total number of bytes required to download before the browser can initially render the page. This number is the sum of all critical resources.
Rendering pipeline
To optimize your website and understand which resources are critical and which aren’t, first you’ll need to understand roughly the process browsers follow when they request and then render the page.
**Note: This is a rough outline, and each step contains some details intentionally left out as they would require entire posts to explain in themselves.
First: Fetch the HTML
The browsers will first make a request to a server, the server will then process the request and serve the HTML to the browser.
Second: HTML is parsed, and DOM constructed

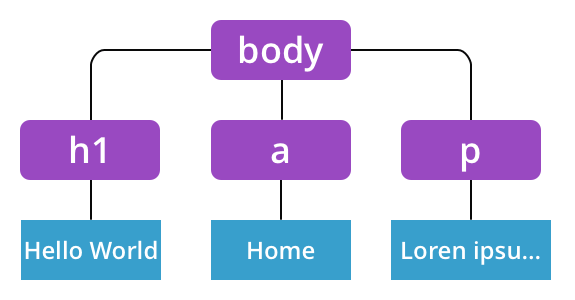
Next, the browser parses the HTML and going from the top to bottom constructs the Document Object Model.
**Third: Critical resources load **
As the browser is building the DOM, it may encounter CSS, JS, images and other assets required before it can render the page. Any of these resources that are marked as “critical resources” will have a request made.
Fourth: CSSOM is then created

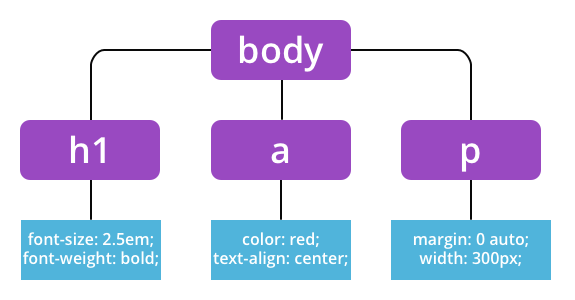
The CSSOM is a tree structure just like the DOM but takes into account the CSS styles which need to apply to the elements. If we don’t link in our stylesheet, then the browser still constructs the CSSOM from “user agent styles” or the default styles that browsers provide.
Fifth: Render tree is created
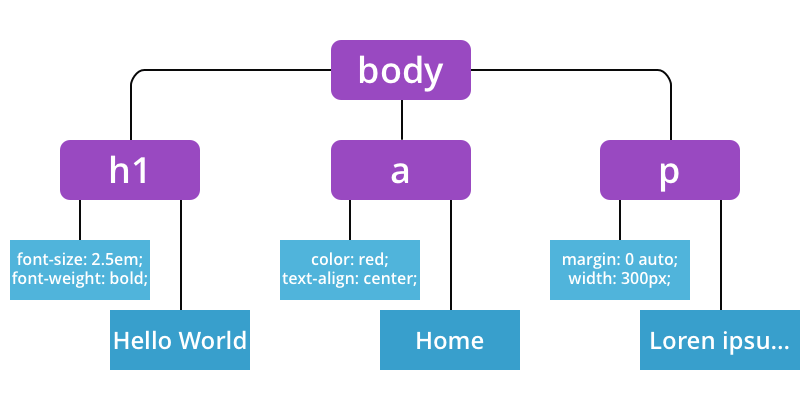
With the DOM and CSSOM created the browser can then go ahead and combine both of these to create the “Render tree.” The Render tree contains all the nodes required to render the page.

Elements which wouldn’t be displayed are excluded from this tree. Elements marked as: `display: none`, script, and meta tags are an excellent example of this.
Sixth: Render the page
With the tree constructed the browser then renders the page, and your website is displayed on-screen.
The above steps occur for all pages. Time to complete this process can range from a few milliseconds when displaying a static website with minimal CSS and JS to a few seconds when serving full web applications.
Which assets are critical?
Stylesheets are critical by default.
To construct the render tree, the CSSOM is required to be constructed first. Therefore, if you have a stylesheet included on the page, then the browser can’t proceed until it is fully downloaded.
Optimization tips
Make use of media queries. Browsers are smart enough to know it can download a print-only stylesheet later down the track and thus it is not critical.
<link rel=”stylesheet” href=”print.css” media=”print”>Don’t use `@import`. Browsers will have to wait for the first stylesheet to download before it can start downloading the @import sheet, delaying time which could have been better used downloading the next stylesheet.
Combine your CSS files. If you have a large number of CSS files combining them will reduce the number of requests and removing extra waiting/stall time with the requests.
JavaScript is render blocking by default
Because JavaScript can query and modify the DOM and CSSOM, by default scripts block the DOM construction and thus delay the render process.
<body>
<h1>Ronald Raygun</h1>
  <script>
    var content = document.querySelector(‘p’); // “Null” because at this stage the DOM hasn’t encountered the “p” tag
    console.log(content.innerHTML); // Error because content is null
  </script>
  <p>Hello World</p>
</body>
When constructing the DOM, when the browser encounters a script, DOM construction pauses until the script executes fully. In the example above, the statement will return null because the paragraph element it is querying is below the script, and therefore is not in the DOM at that time.
document.querySelector(‘p’)In a “real world” scenario you are not likely to have a large script inline, but by default, even external script files are render blocking, and the browser will then have to wait for the request to be made as well.
<body>
<h1>Ronald Raygun</h1>
  <script src=”myapp.js”></script> <!-- Still pauses DOM construction -->
  <p>Hello World</p>
</body>
**Optimization tip: **Mark scripts as async
Marking scripts using the async flag tells the browser not to pause DOM construction while it is downloading the script. Meaning the browser will continue to parse the DOM and will start loading any other assets it encounters. One “gotcha” with this is that async scripts aren’t guaranteed to execute in the same order. If the order of script execution matters to your project, look into the “defer” attribute.
Images and fonts
Images and fonts are not critical resources. We still want them to load as quickly as possible but they don’t block the browser from constructing the render tree, and so browsers will “make do” until the assets have finished downloading.
Images are progressively rendered as they are loading, which is especially slow with large unoptimized images.
Browser font renderer depends on the browser used. IE renders a fallback font immediately, whereas Chrome and Firefox will only display a fallback font after 3 second delay.
Measuring your asset loading time and performance
When it comes to measuring page load speed, there are a variety of statistics available that you can use. Arguably the three most important ones are DOMContentLoaded, first paint and load.
DOMContentLoaded is the time it takes the browser to construct the DOM without stylesheets.
First paint is the time it takes for the first render to occur. When users say the website is slow, this is often what they mean. If we can improve this metric, then users will have a perceivably better experience.
Load is the time it takes for all assets to load, including stylesheets, images, and fonts. (Every asset included in the page.)
Measure using the Navigation Timing API
The above timings can are accessed via the window.performance API.
const navigationTimings = window.performance.getEntriesByType('navigation')[0];
const paintTimings = window.performance.getEntriesByType('paint');

console.log( navigationTimings.domContentLoadedEventStart );
console.log( paintTimings[0].startTime );
console.log( navigationTimings.loadEventStart );
Measure using Chrome Developer Tools
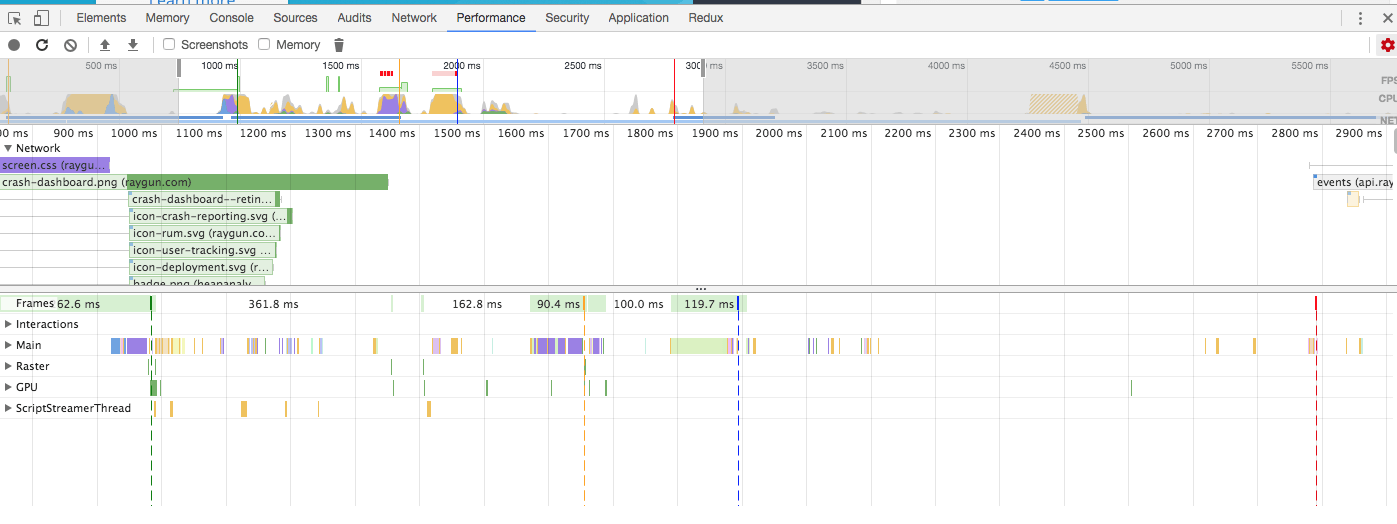
Making use of the performance tab in the Chrome Developer Tools allows you to view a flame chart visualizing when the assets were loaded over time. Vertical lines are also shown highlighting the events above.

- Green represents the First paint
- Blue represents DOMContentLoaded
- Red is Load
Start measuring!
When developing a website we never intentionally make them slow. Priorities change, we add more features, and before you know it, your static site becomes a fully fledged resource-hogging web application.
Hopefully using the tips above you can start serving content to your users sooner, giving them an improved experience by slashing asset loading time.
Additional performance tips to get your website running like clockwork
Before wrapping up, here are a few extra performance tips you may want to implement:
- Minify your assets. The less byte the browser has to download, the quicker the browser can render the page
- Combine assets where it makes sense. These can lead to fewer requests and thus less performance overhead
- Test on actual devices and network conditions. Just because it is fast locally doesn’t mean it’s quick with internet weather conditions