Reports in Crash Reporting: A detailed view oF errors impacting your users
Posted Feb 2, 2022 | 4 min. (681 words)Raygun customers at the Team level can create a single custom reports to display their most vital data points. Business users can create up to five, and Enterprise customers have unlimited access.
Reports for Raygun Crash Reporting allows you to construct your own custom reports based on the data and criteria that you’d like to see and segment. For example, if you release a new version of your website and would like to see a detailed view of the errors affecting end users, Reports will allow you to get details quickly.
You can use Reports to:
- Extract, surface and compare custom data and fields from the error payload
- Analyze errors in more detail by applying primary and secondary filters
- Download reports as CSVs for further data analysis outside of Raygun
- Schedule reports to be generated at a frequency that suits your own reporting needs
Why we store everything
Other crash reporting solutions sample or replicate data when they see recurring instances of the same error, storing only some of the data. Raygun stores every single error occurrence, not losing any unique detail that can help in faster error resolution. This means all of the data is at your fingertips, ready to be segmented on your own specific rule sets.
Where to find the Crash Reporting Reports feature:
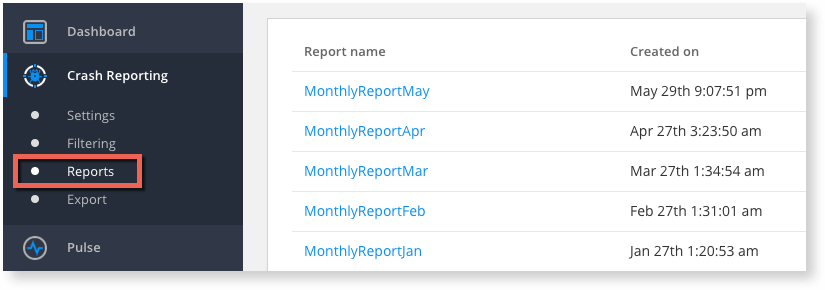
You can find the Reports link underneath the Crash Reporting section in your dashboard under the application:
What makes up a Raygun Crash Reporting report?
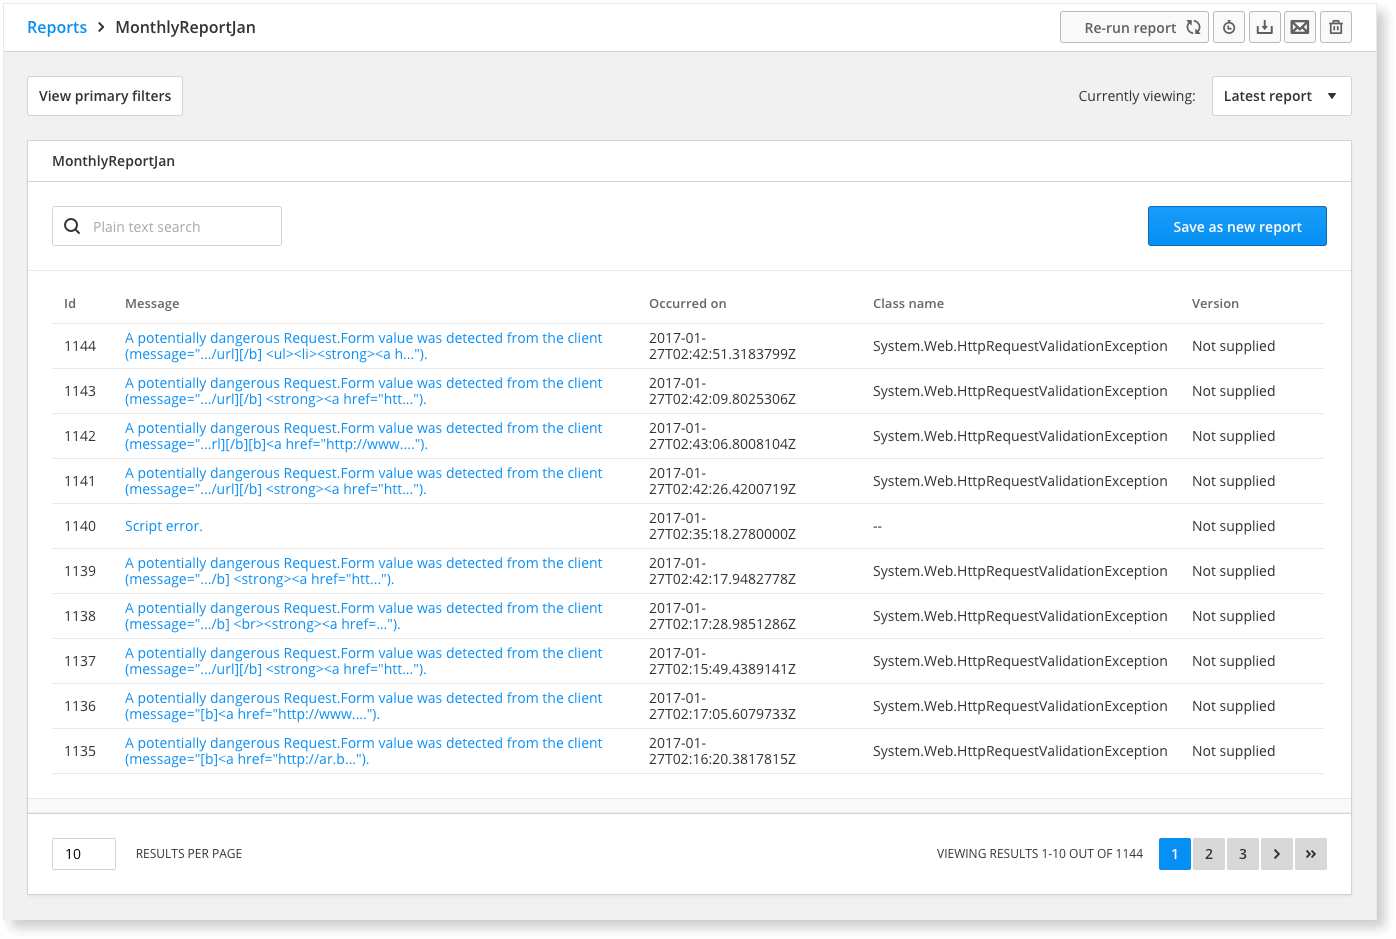
A lot of our customers requested for their crash data to be ordered by different columns, so we made sure to add this as a feature. The columns of a report represent the data found in the properties of an error report sent to Raygun. With reports, construct as many columns as you’d like, using the metrics that only you care about. Common properties are provided to choose from and we also allow you to construct columns from your own custom properties.

Primary filters are a way of selecting which error reports to process for your report. For example you can add a version filter to only process error reports whose version is greater than or equal to one:

What does a report look like?
Once successfully generated, you will be able to view the report in the Reports section of the dashboard:
What can you do after a report has been generated?
Apply secondary filters
Secondary filters are applied to the columns of your report, allowing you to further refine your results without permanently removing entries:

Re-run the report
Re-running a report will put the report back into the queue to be processed again with a new date range. This can be useful if certain error reports you wish to include fell just outside of the original date range.
Schedule new Crash Reporting reports
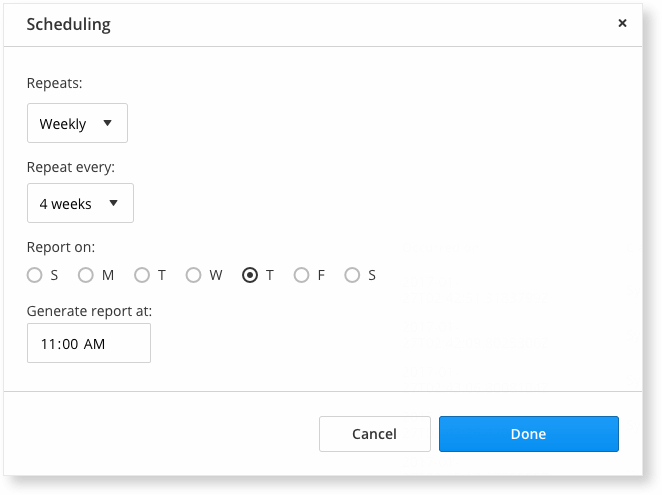
Once a report has been successfully generated, it is eligible to be scheduled again. Scheduling allows you to reuse the same report definition of columns and filters to generate new reports at a frequency that suits your own reporting needs.
View the report history
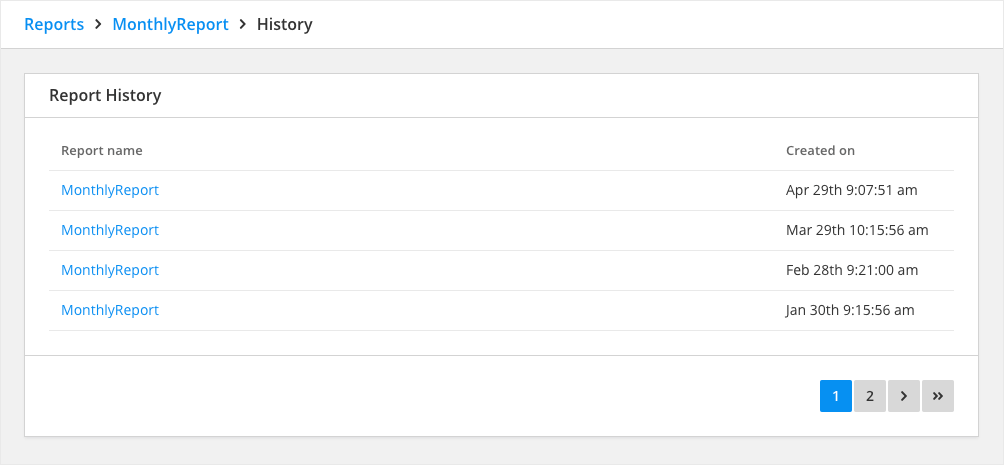
Re-running or scheduling the same report will construct a report history. The history list contains links to other generated reports that share the same report definition:
Manage your reports
We provide a variety of ways to manage and store your reports. The number of reports you can generate is based upon your plan size.
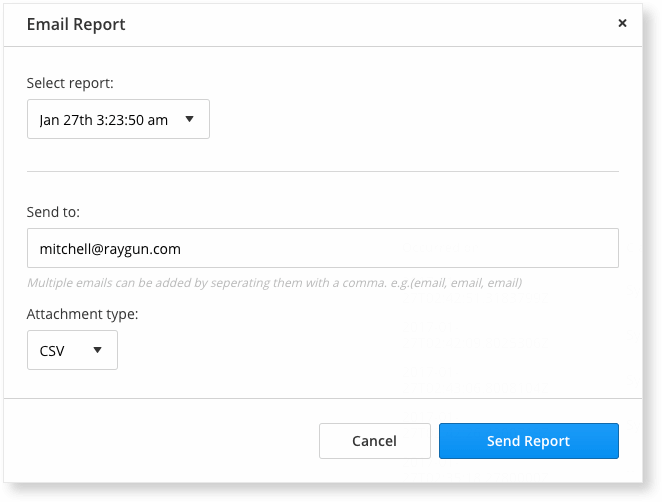
Download reports as CSVs for further data analysis outside of Raygun. Reports can also be deleted once they have been successfully generated. We also provide a quick solution to emailing specific reports with a downloadable link to others from the dashboard:
Now you have the flexibility to start constructing your very own custom reports based on only the data you need.
The process of constructing Raygun Crash Reporting reports is also explained step-by-step in our documentation here. If you have any questions about reports, or if you need to upgrade your plan to get the full benefits of reports, you can get in touch with a friendly team member here.


