Crash reporting and APM: What’s the difference?
Posted Dec 6, 2017 | 7 min. (1310 words)How do crash reporting and APM (Application Performance Monitoring) differ? After all, both promise to detect problems affecting your users and both advertise that they discover errors or crashes.
The most important difference is that crash reporting gives insights into errors that your end user experiences. APM, in contrast, gives insights into application performance like slow experiences that would never be spotted using crash reporting alone.
Both tools are similar in that they provide detail into the health of your application and how it’s performing for end users. So, many engineering teams don’t choose between one or the other; they use both.
If you are considering either crash reporting tool or APM, this guide will help with the core differences. I’ll also look at why they might be better together for your engineering team.
Different levels of data on software errors
To understand the differences between crash reporting and APM, we can take a look at the level of data they collect around problems affecting end users, like software crashes and errors.
Firstly, crash reporting tools offer a granular view of software errors discovered in your front-end and back-end code. They automatically surface contextual information on every single error and crash. Although that sounds like a lot of notifications, intelligent error grouping collects the errors around the root cause. They offer technical teams full stack traces, OS, browsers, time and date, headers and raw crash data to debug the problem with ease. Crash reporting tools are therefore extremely good at giving you the information needed to solve the more straightforward problems affecting customers. When it comes to solving the more complex problems, you need APM to add more detail, and that’s why they work so well together.
APM tools, in contrast to crash reporting, offer metrics on the performance of your application on the server side. For example, you may need to know what sort of web activity made a whole server unresponsive. APM tools will usually produce a graph on the dashboard showing error detection trends over time, and, if you’re lucky, a little more information on their cause. Generally speaking, they lack the deeper diagnostic information developers need to resolve errors — for example, the stack trace.
Some APM tools offer a crash reporting feature, but a dedicated crash reporting tool is usually the best option if you need to get to the bottom of errors and crashes in your app. The reason these tools work better together is you can compare if the server caused any exceptions for a particular user during a specific time frame. When crash reporting and APM work together, you can also see which user actions caused the error — all helping to save valuable time when replicating and deploying a fix.
Installation process
Currently, most APM tools on the market require you to install an agent on each server you want to monitor. This can be quite a convoluted installation process if you are an enterprise team running 50+ servers. Getting that into production comes with complexity, therefore involves recruiting resources and decision makers every step of the way. It also comes with potential performance overheads, as agents are not free in terms of resource consumption.
Error and crash reporting tools, on the other hand, may only require a small code snippet you add your app once you have installed the library. Each crash reporting provider offers the ability to monitor each application you have.
You could have crash reporting set up and in production within minutes, as there is no agent to install, extra set up, or risk associated. It’s just like a tracking script sitting there silently monitoring for when errors and crashes occur, sending those details to your dashboard for review.
Make a coffee and hook it up before you see the bottom of the cup.
Integrations and workflow features
Because crash reporting and APM tools surface different data, they have different integrations and workflow aids inside their software. Crash reporting’s integrations surface the diagnostic details of errors in a way that is most efficient for your team. To do this, they integrate with issue trackers, (like Jira), ChatOps software, (like Slack) and repository software (like GitHub).
Error and crash reporting tools also offer workflow features like labeling, tagging, and grouping errors. For example, in Raygun, you can mark bugs as ‘resolved,’ so if they reoccur, they’ll be labeled as ‘active’ again. Many teams aim to achieve an ‘error zero’ approach to issues in their apps, marking them as resolved and minimizing the number of active problems affecting users. The export functions then close the loop on errors fixed with reporting.
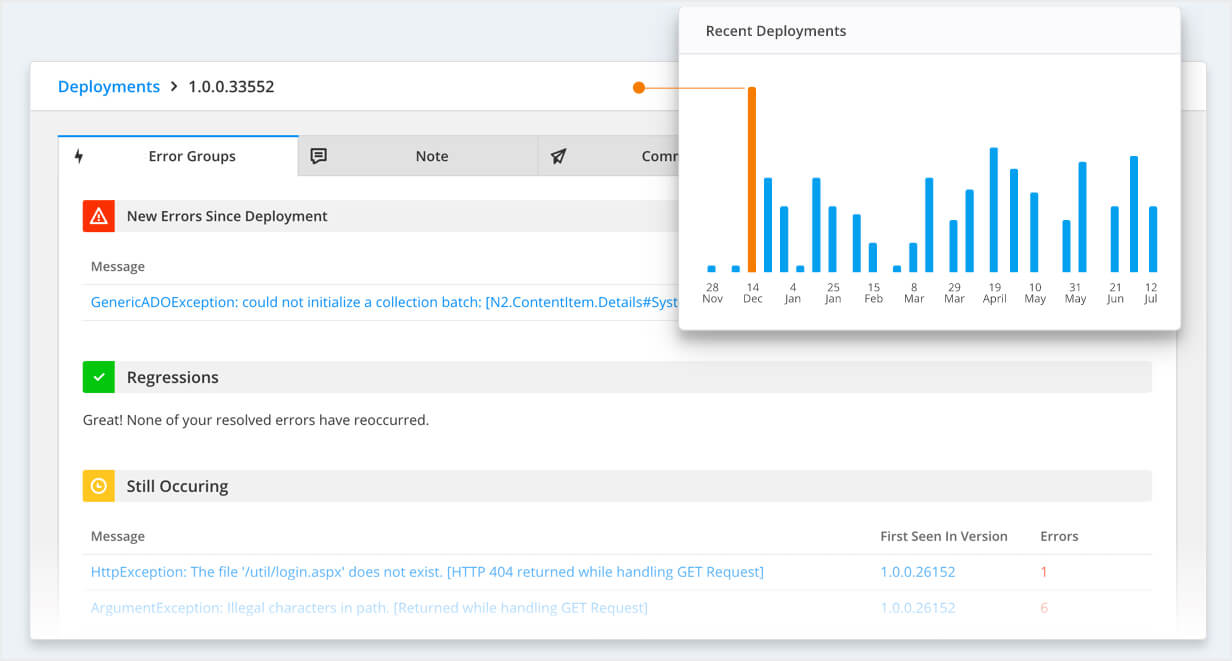
Deployment tracking is another workflow aid crash reporting offers. The deployments feature in Raygun correlates high error counts with deployments so you can mark errors as ‘resolved’. This gives reassurance a deployment didn’t create more problems.
APM tools work similarly. They aim to surface data in the most efficient way possible, and some integrate with issue trackers and ChatOps software. With APM, workflow features focus more on providing a high-level server performance metrics that users see in your applications.
Levels of detail on your users
If you could see how many users are affected by particular errors, which errors would you fix first?
Hopefully, you’d say the ones that are affecting the largest numbers of users. And you’d be right — after all, it’s about the end users and giving them a great experience. But how do you discover that information in the first place?
Crash reporting tools identify not only which errors are happening, but also to which authenticated users they are happening. Therefore, you can prioritize fixes accordingly. The level of information surfaced about your users enables you to see which problem a specific user encountered. Using a user tracking functionality, you can even reach out to them personally with an apology. Users won’t need to submit a support ticket or have any interactions with you. You’ll just know they had that issue and be able to address it promptly.
Support requests for technical issues become easier. With Raygun crash reporting, for example, you can search the email address of the user complaining about a problem. Depending on the level of sensitive data you have allowed for, Raygun surfaces their user profile and every error they’ve experienced.
APM tools, in contrast, retrospectively show your error trends over time on a big dashboard in the office, but they don’t promote that these are real problems experienced by your customers. When monitoring the server side of your app, high-level charts on which pages are performing poorly are important. However, it’s the mechanism to understand what to improve and why that is missing. Sometimes your APM dashboard may get clogged with information that isn’t part of your SLAs (service level agreements.)
So, when crash reporting and APM tools work together, you can spot a problem on a page caused by a server error, then take a deeper dive into what caused the problem, and who is affected, with crash reporting.
Crash Reporting and APM work better together
There are many tools on the market these days designed to better understand the nuts and bolts of your application’s performance. So, hopefully, this article has given you a better idea of where crash reporting and APM tools fit into your development workflow. When you add APM data to crash reporting, you build a very clear picture of how your software is acting for your customers. For this reason, many of Raygun’s customers use APM tools alongside crash reporting (and our real user monitoring tool).
For more clarity on software errors that are affecting end users take a free trial of Raygun.
You may also like:
Crash reporting and issue tracking software: What’s the difference?