A guide to Breadcrumbs for Raygun Crash Reporting
Posted May 16, 2017 | 3 min. (535 words)This article was last updated in December 2018 to include Raygun4Apple.
Breadcrumbs allow you to attach an accurate trail of the events through your system leading up to the moment a crash report was generated. You’ll gain more insight into why the application crashed when it did, making prioritization of fixes much easier.
There are two ways Raygun reports Breadcrumbs:
1. You can choose specific portions of your code you deem important and manually leave breadcrumbs there with information about the state of the system.
2. Certain providers will automatically create Breadcrumbs for some specific important events (e.g. network requests, element clicks, and database queries)
This has been a highly requested feature and we are excited to bring it to the Raygun Software Intelligence Platform (what is software intelligence?) to make it as easy as possible to figure out why crashes happened.
Breadcrumbs documentation
- Raygun4JS - Supported in version 2.6.1 and above
- Raygun4Net - Supported in version 5.5.0 and above
- Raygun4Ruby - Supported in version 2.1 and above
- Raygun4Java - Supported in version 6.0 and above
- Raygun4Apple - Available for ioS, macOS, and tvOS
Where to find the Breadcrumbs feature
You will be able to find the trail of events inside the ‘Breadcrumbs’ tab on a crash instance. Any crash report that comes in with Breadcrumbs attached will have this tab:
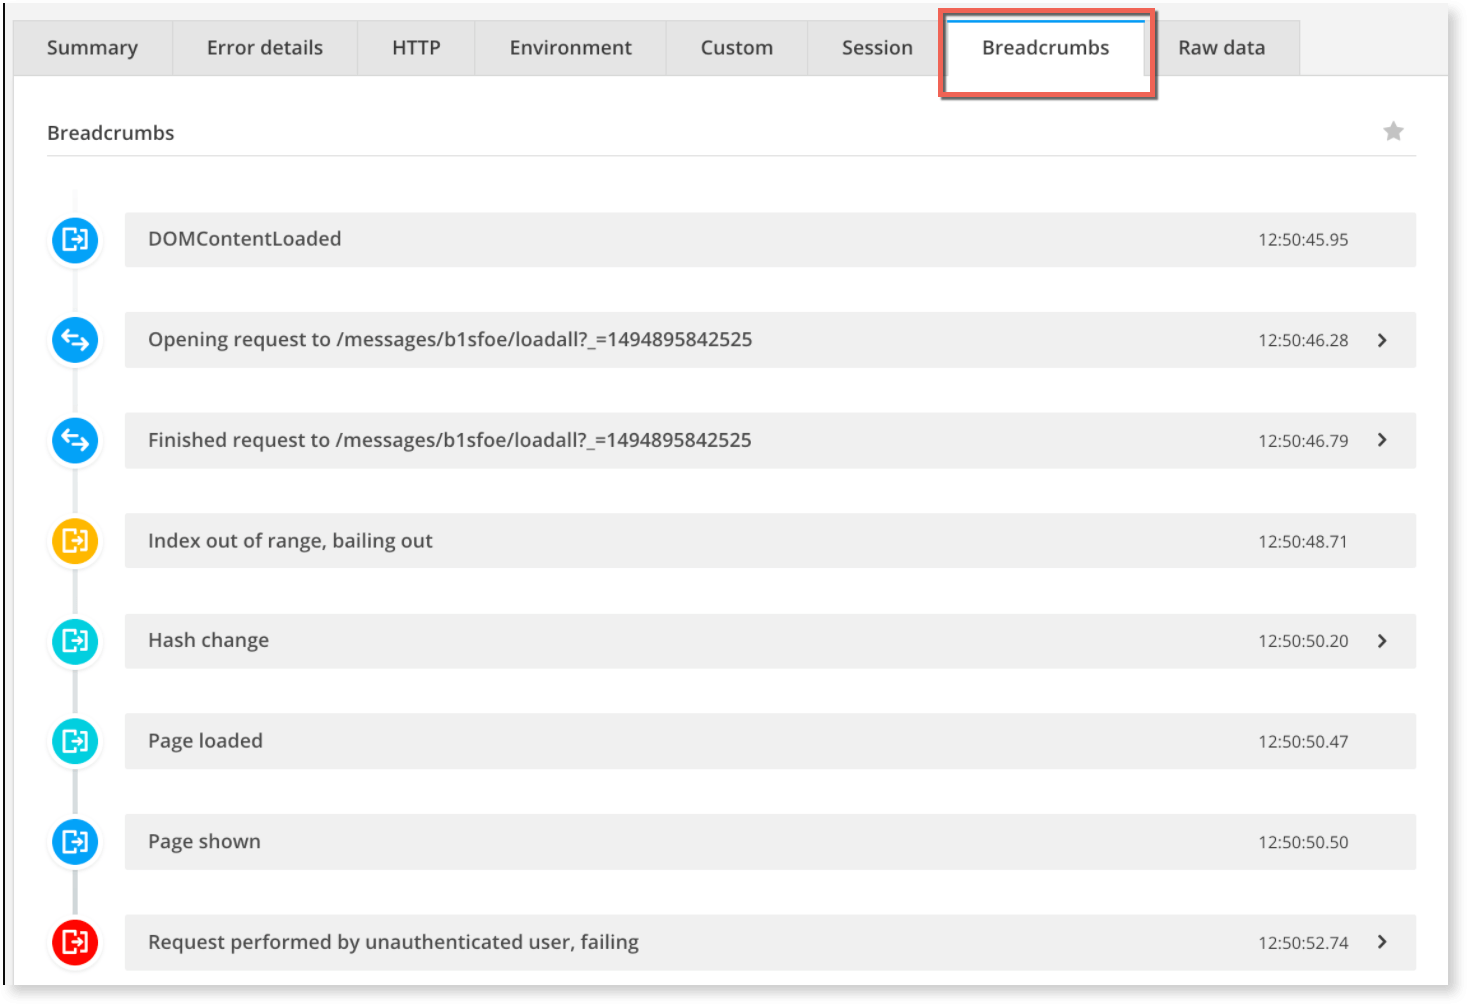
Inside this tab, you can see all the breadcrumbs attached to the error. These are in order from oldest to newest. Each crumb has an associated icon (i.e. how it was logged, a network request, or a DOM element click). The icon’s color is representative of a user supplied severity, and important events will stand out making-at-a-glance prioritization even faster.
Blue icon = debug
Teal icon = info
Yellow icon = warning
Red = error
Severities are handled similarly to logging frameworks, with the available options being debug, info, warning and, error. In each of the providers, you can set a minimum level of breadcrumb to report. This way you can add detailed debug breadcrumbs but only enable them in the situations you need to avoid cluttering your breadcrumb trails with excessive information.
A quick mouse-over the icon will reveal the origin of the problem:

Indicates a navigation problem

Indicates a request problem
Key use cases
Some of the key uses for the Breadcrumbs feature can be tagging key service object calls, along with their return values. Another is your interactions with third party APIs and their responses to give you a better understanding of where problems may have occurred in your external integrations.
Raygun4js automatically records a number of things; console messages, network requests, navigation events and element clicks. With this information, Breadcrumbs make it easier to understand how your user interacted with the application, and exactly what caused them to experience an error.
Raygun4js is currently the only provider to automatically record Breadcrumbs; we will be updating the backend providers to automatically include different events, including database queries and log statements over time.
Watch this space for more details. We’ll be announcing updates as they are released.
Do you have questions about the Breadcrumbs feature? Get in touch with a friendly team member here.