A first look at Amazon CloudWatch Real User Monitoring
Posted Dec 15, 2021 | 9 min. (1835 words)Real User Monitoring (RUM) has been providing valuable insights into real user experiences for many years. It’s not every day that we see a new player enter the market, but last week we did, and a very powerful player at that – Amazon. Real User Monitoring for Amazon CloudWatch was announced at AWS re:Invent 2021, adding to their existing suite of over 200 products and services. As you can imagine, our ears perked up at this announcement and we’re eager to take a look.
With Raygun having its own established Real User Monitoring solution since 2015, we like to think we know a thing or two about what makes a good Real User Monitoring tool. We’re excited to see what new ideas and functionality Amazon brings to the industry, and what direction they see RUM taking in the future. After all, who doesn’t like a challenge?
Today, we’re going to install AWS CloudWatch Real User Monitoring and try it out for ourselves. Before we get started, though, let’s try shortening the name, because none of you want to hear me say ‘AWS CloudWatch Real User Monitoring’ any more than I have to. How does CW RUM sound? Good? Ok, Good. Now we’ve got that out of the way, let’s check it out!
*Disclaimer: Before we jump in I would like to point out that I am an employee of Raygun, which has its own Real User Monitoring solution. I have attempted to be as objective and impartial as possible while writing this review, but naturally, I will have implicit biases and opinions around what makes a ‘good’ RUM solution.
Getting setup
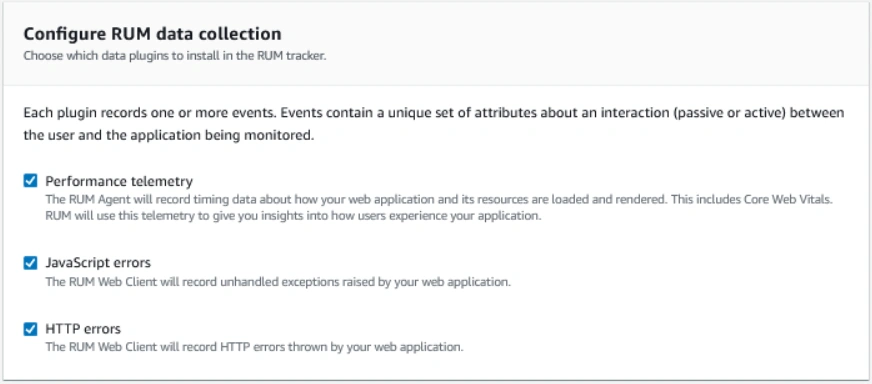
Setting up CW RUM was a fairly simple process. First you have to select which app to monitor (giving it both a name and domain). Next, we configure how data gets collected. It’s worth noting that CW RUM only works for web applications, so the data collected is relatively limited with the option to select performance telemetry, JavaScript errors, and HTTP errors. For the RUM aspect of their solution, you only really need to select ‘Performance telemetry’, but let’s select all three regardless to see what they’ve got.
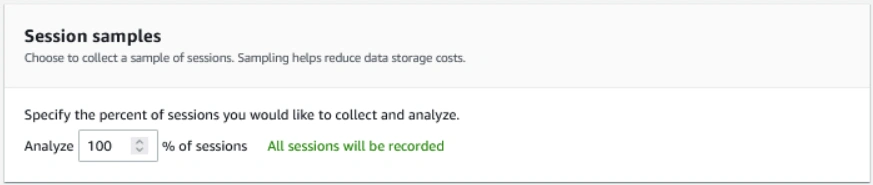
Next, we’re asked to select what % of sessions we’d like to sample and analyze. Since we’re working with a site that has a fairly low amount of traffic, we’re going to keep this option at 100%. If you’re a price-sensitive team, this option can provide a lot of value, giving more autonomy over your bill. However, for the most part, you’ll want to get complete visibility into how your users are experiencing your application by selecting 100%.
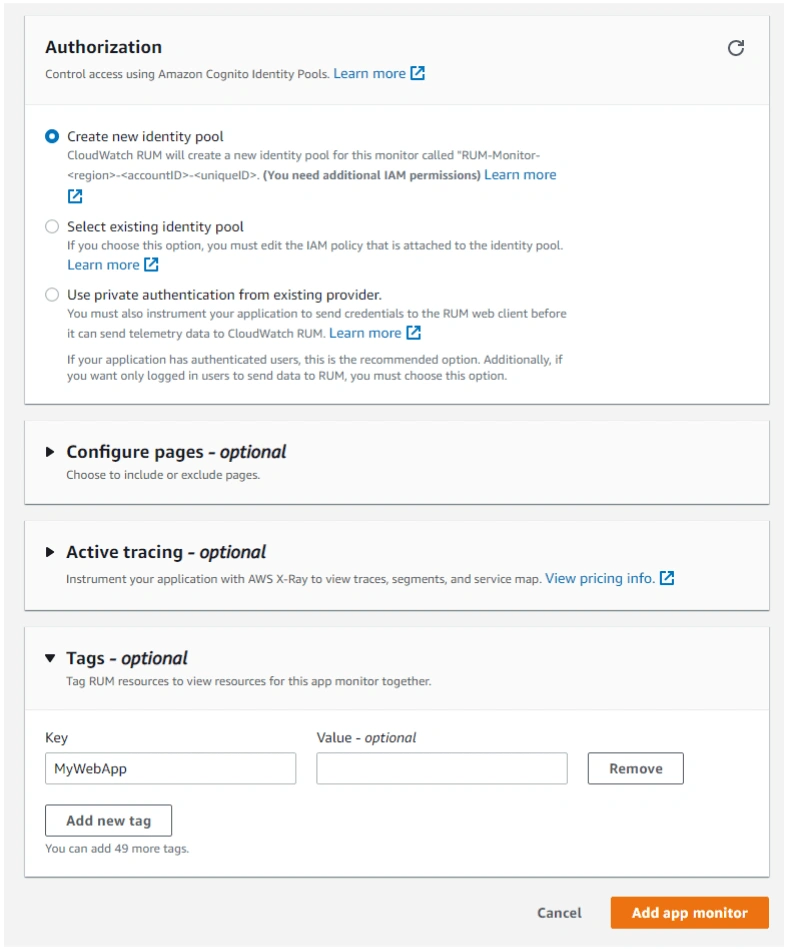
Next, we set up our authorization settings and configure pages, set up tracing, and add tags. For now, we’re going to leave the optional settings.
Ok, now we’re getting somewhere! Time to add our code snippet to the
element of our application.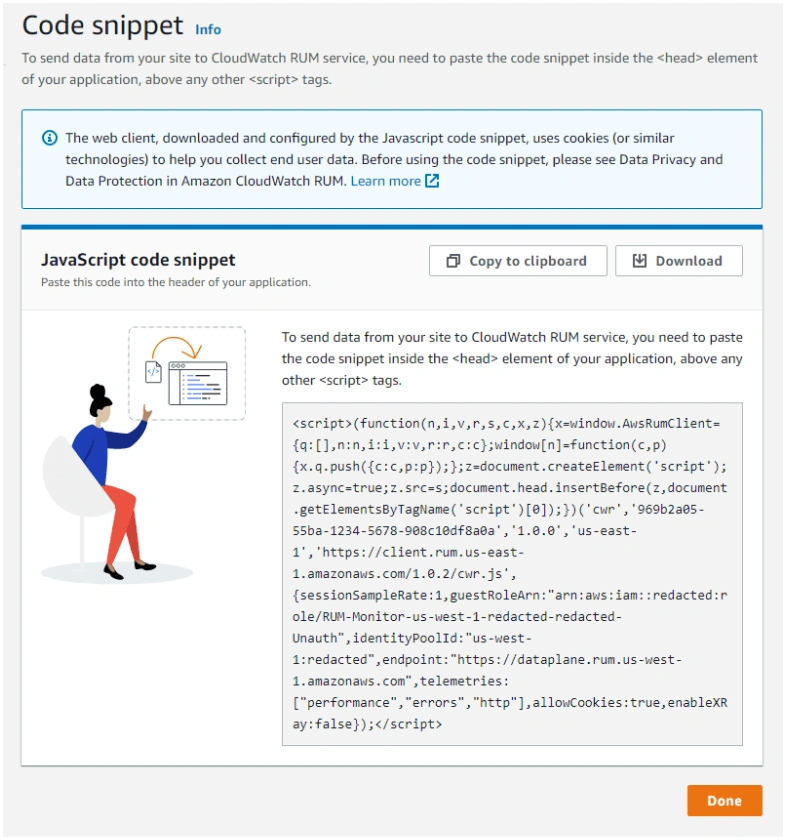
Now that we’re all set up, it’s time to play the waiting game until data gets piped through. Time to grab a glass of wine, kick up my feet…
First impressions
…And, we’re back into it. Now that my application has been populated with enough traffic from real users, I can finally do what we’ve all been waiting for – click in and see what information they have for us. I won’t comment too critically on the UI/design, as I’m acutely aware that AWS has their own standards and protocols around how everything has to look. If you like the design of the rest of the suite of AWS tools, you’ll like the look of CW RUM.
When clicking into my application, you’ll be taken directly to the ‘Performance’ tab. This seems like a good place to start with our investigation!
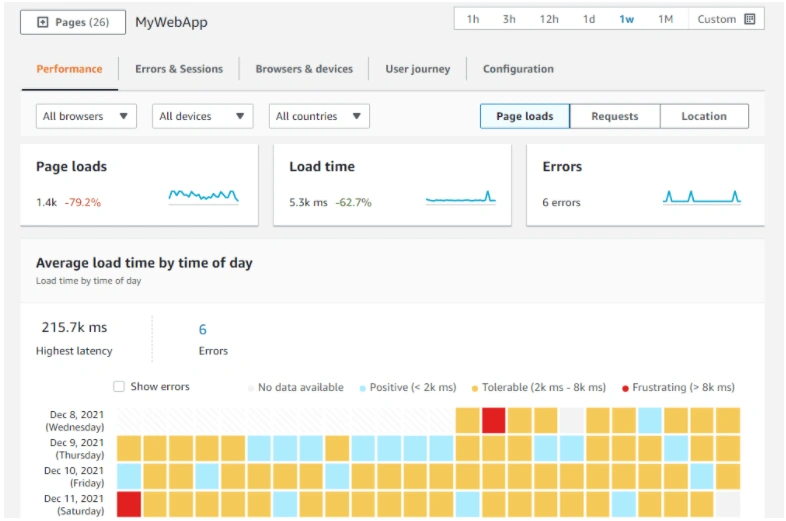
The top of the page is populated by page loads (good for monitoring traffic), load time (a staple for anyone measuring performance), and errors (another staple for any developers wanting to keep an eye on the health of their application). Personally, I would have liked to see an x-axis on these three graphs, regardless of knowing that it’s one day worth of data based on the time picker in the top right corner. This would have helped with identifying the cause of spikes (for example, if I merged a deployment at 1pm, I would have no way of knowing if the spike on this graph was related to the deployment at 1pm).
Core Web Vitals
The second thing that stood out to me on the Performance tab was the inclusion of Web Vitals (and more specifically, Core Web Vitals). This was a great move. Google introduced the Core Web Vitals (CWV) last year, and they’ve fast become the metrics to prioritize when improving the user experience. CWV are heavily tied to the user experience, with a focus on the perception of how a page loads. I thought it was an interesting decision to move away from the terminology ‘good’, ‘needs improvement’, and ‘poor’, defined by Google, but fundamentally it should still work the same.
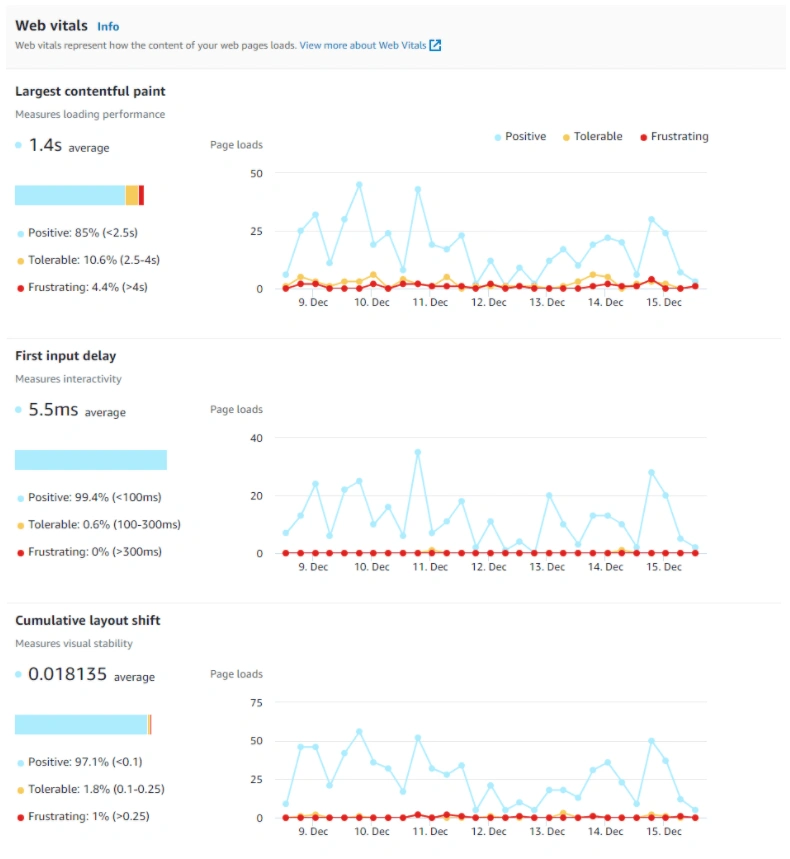
Google uses Core Web Vitals as a ranking factor for organic search. One potential oversight that I can see with how this was implemented was the lack of a ‘P75’ filter. When ranking your page on search, it’s done based on the 75th percentile of users. This means that 75% of your users have to be above Google’s definition of ‘good’ on any given page for it to be ranked as ‘good’ in practice. The fact that these metrics are currently only being tracked as an ‘average’ makes it impossible to tell when you meet Google’s required threshold. Regardless, I’m glad to see Core Web Vitals included in this initial launch.
Being able to track these metrics over time is a nice touch. Every team needs visibility into how these metrics are trending over time in order to accurately assess the impact of their optimizations.
If you want to learn more about Core Web Vitals, you can read ‘The Developers Guide to Core Web Vitals’, which goes more in depth about what they are, why they’re important, and how you can improve them.
Page load steps over time
The next element on the Performance tab is the ‘Page load steps over time’ graph.
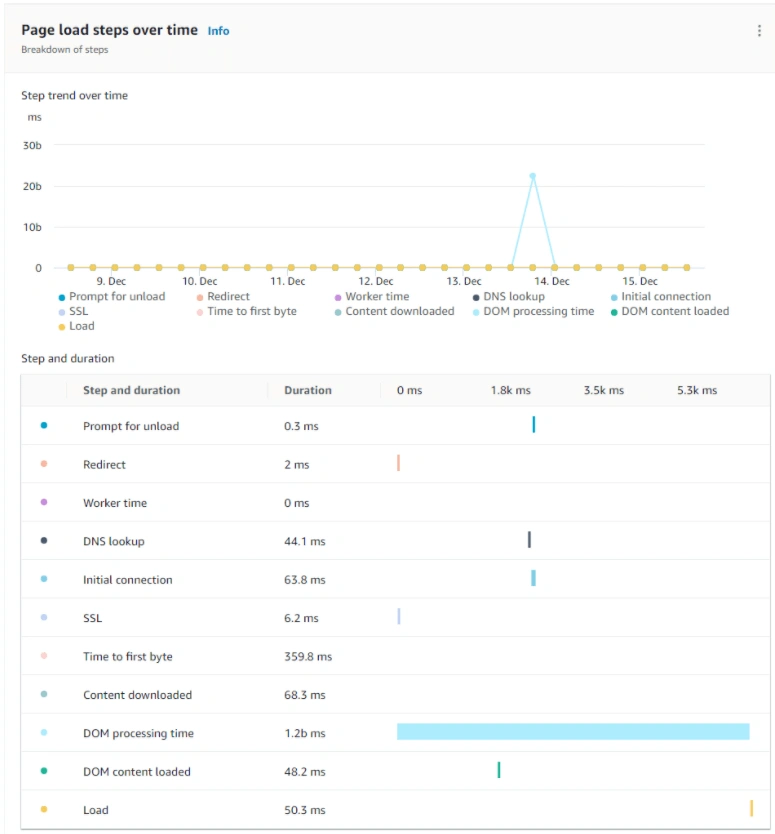
This is interesting for seeing which steps are slowing down the load time of your page, but ultimately lacks the depth to tell you anything actionable/specific.
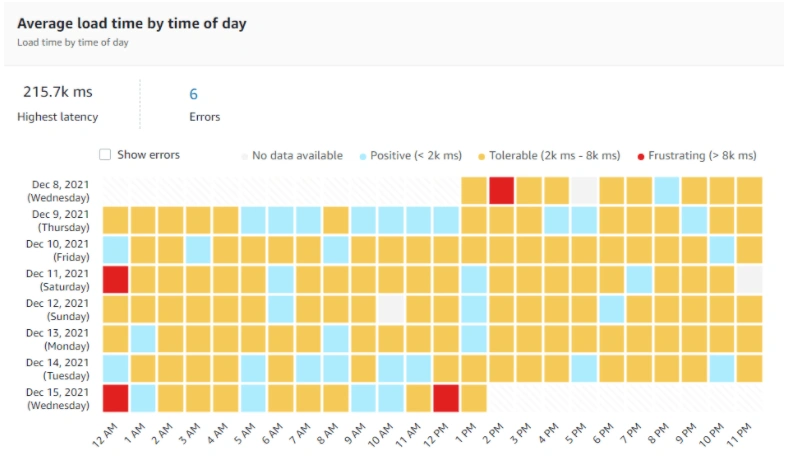
Average load time
I think the average load time by time of day graph can speak for itself for the most part. My gut feeling is that this graph is going to largely be dictated by which time zones are most active at different times throughout the day, but if used with this in mind, you could get some useful insights out of it.
Browsers, devices, and the user journey
The bulk of the initial offering is contained in the main Performance tab, but let’s have a poke around to see what else CW RUM has to offer.
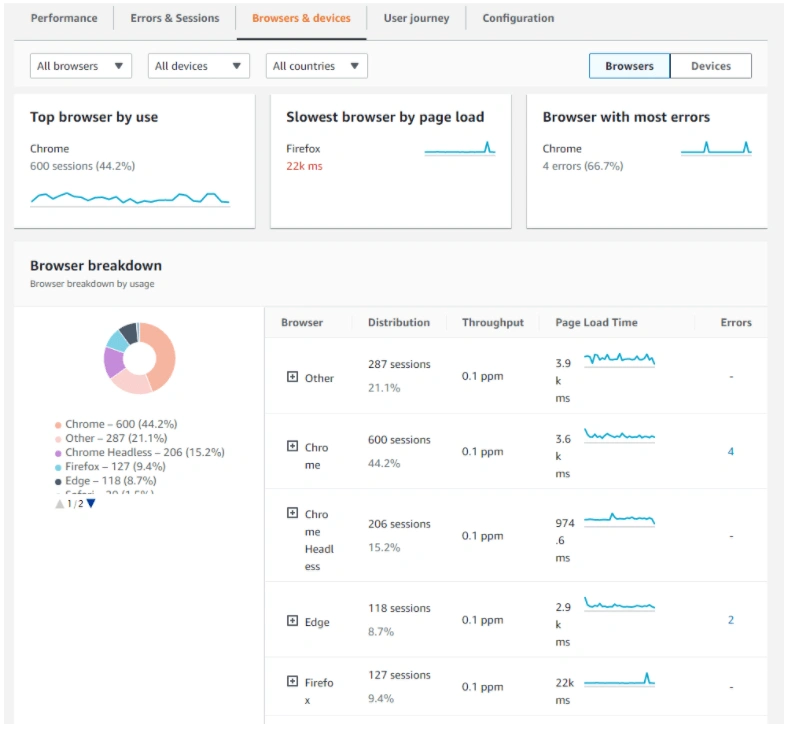
The Browsers & Devices tab shows us some interesting information about where our users are visiting from. Once enough data comes through, I’d be surprised if either the ‘Top browser’ or ‘Slowest browser’ would change much, if at all. There isn’t anything particularly actionable on this page and can only be used to get a ‘state of play’ of browser and device distribution. It’s worth noting, however, that a session is only counted in CW RUM if a user encounters an error. Currently, if a user visits your website and doesn’t encounter an error (which is an ideal situation), you’ll have no visibility into that session, as it never gets counted.
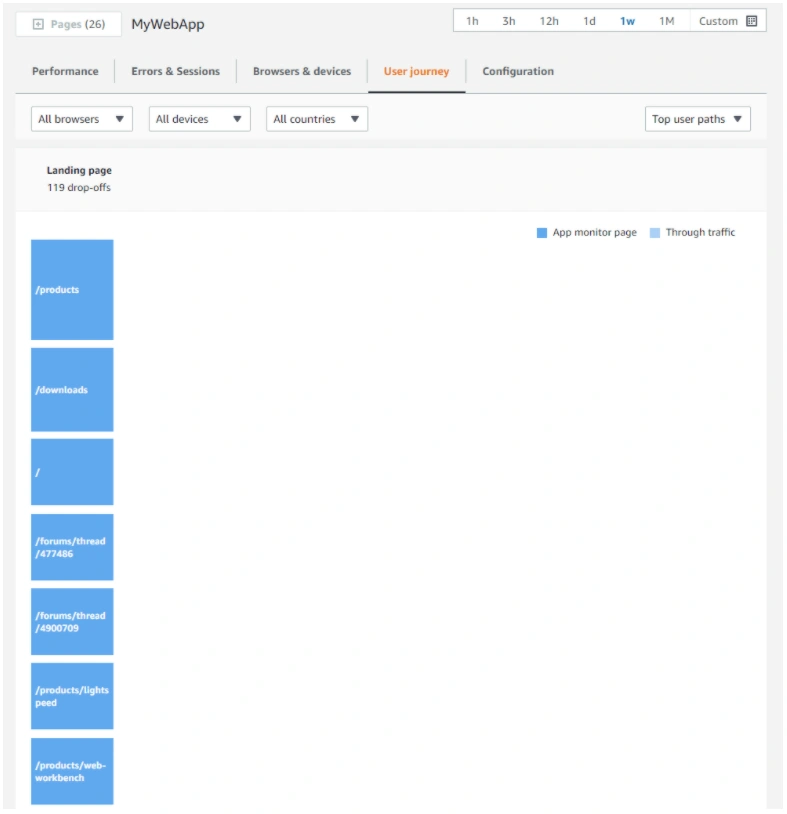
The final section that we’re going to look at (very briefly) is the ‘User Journey’ tab. On release, this tab is simply put – broken. As it currently stands, it is impossible to get CW RUM to generate a second pageview, as every page you land on is counted as the ‘Landing page’. I imagine this will be fixed in the near future. If you’ve ever used Google Analytics, it seems like this will eventually be a simplified version of their ‘Behaviour flow’ feature.
Is anything missing?
There were two major things missing from the initial CW RUM offering that I believe should be present in a modern RUM solution. Both of these provide an opportunity to develop deeper/richer data insights, although in slightly different ways.
The first was that for a RUM solution, there was a serious lack of visibility into ‘real’ user sessions. A modern RUM solution can take you down to specific users, with detailed insight into how a session was executed. Without this in place, you can only see that something went wrong for a cohort of users, without being able to see what those users were doing to run into the issues in the first place. This complicates the task of replicating the problem and ultimately solving the issue for your customers.
The second big gap that I saw was the the lack of detail into code execution. A major aspect of what makes a RUM tool powerful is not just knowing what went wrong, but also how to fix it. While using CW RUM, I felt like I would pull on the thread, and inevitably reach the end of the rope, scratching my head thinking ‘what next?’. This solution for this problem will often come in the form of a waterfall graph which CW RUM currently doesn’t offer.
Ultimately, these deeper insights are tied to the ability for developers to take action using RUM data, which at the moment is a tough ask based on the surface-level data provided. Regardless of these missing pieces, I’m still impressed by how much the AWS team managed to cram into their initial launch. I’m just hoping that we’ll see these holes plugged sooner rather than later.
Final thoughts
It’s exciting to see a new player in the Real User Monitoring space and I’m looking forward to seeing where AWS decides to take this product offering moving forward. Currently, you’re able to get some good high-level insights by using CW RUM, but it lacks the depth provided by existing solutions on the market. It’s still a brand new tool, and I have no doubt that the tool we see today will look nothing like the tool in a couple of years and that it will eventually take on a life of its own.
For now, I can only talk about the tool we have today, and unfortunately, it’s not quite where it needs to be yet. This current release feels rushed, with multiple weird and often objectively broken things being pushed into production on launch. If nothing else, this emphasizes the importance for modern development teams to have a RUM solution, regardless of which tool they end up using.
*Want to give Raygun Real User Monitoring a try? Simply sign up for a free trial with unlimited monitoring for 14 days. Pricing is flexible and usage-based, with unlimited apps and users.