API update: Metrics
Posted Aug 15, 2024 | 6 min. (1239 words)We recently released two new Raygun API endpoints that expose time series aggregations for particular metrics. They enable you to consolidate your company’s metrics into an external dashboard (such as Grafana, Tableau, or PowerBI), correlate errors and page performance with data points that Raygun cannot see, or even perform advanced data analysis.
Currently, we have two metric categories available: those that pertain to pages (relevant for Real User Monitoring) and those that pertain to errors (relevant for Crash Reporting).
| Page Metrics | Error Metrics |
|---|---|
| Page Views | Error Instances |
| Load Time | |
| First Paint (FP) | |
| First Contentful Paint (FCP) | |
| Largest Contentful Paint (LCP) | |
| First Input Delay (FID) | |
| Cumulative Layout Shift (CLS) | |
| Interaction To Next Paint (INP) |
Page and error metrics are available through two separate endpoints so different PAT scopes can secure them:
POSThttps://api.raygun.com/v3/metrics/{app-id}/errors/time-seriesPOSThttps://api.raygun.com/v3/metrics/{app-id}/pages/time-series
These endpoints require the metrics:errors and metrics:pages scopes respectively.
You can find the full specification of our endpoints here.
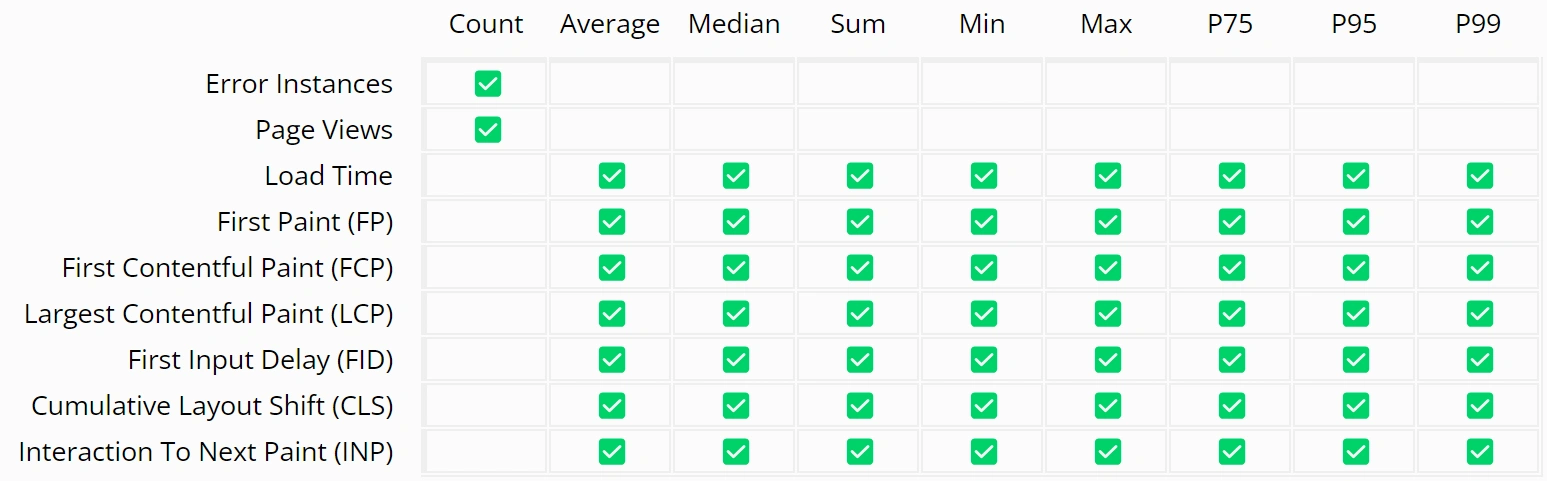
When you request metrics, you must also specify your desired aggregation. We currently support the following aggregations: Count, Average, Median, Sum, Min, Max, P75, P95, and P99.
Not every metric supports every aggregation. Some metrics are count-only. The metric-aggregation compatibility chart below shows this.
Building a request
Let’s familiarize ourselves with the available POST body properties. For demonstration, we can build a request to the error metrics endpoint.
At launch, this endpoint only supports the errorInstances metric paired with the count aggregation. The JSON body of the request for our chosen metric-aggregation combo might look something like this:
POST https://api.raygun.com/v3/metrics/{app-id}/errors/time-series
{
  "start": "2024-08-15T02:10:02.202Z",
  "end": "2024-08-16T02:10:02.202Z",
  "granularity": "1m",
  "aggregation": "count",
  "metrics": [ "errorInstances" ],
  "filter": "errorGroupIdentifier IN (abc123, def456)"
}
You’ll notice more properties than just metrics and aggregation.
Here’s a rundown of the other properties:
-
startandend: The date/time range for the time series. -
granularity: The interval at which data points are returned. We currently support a minimum granularity of1m, meaning each data point, or “bucket,” in the series represents one minute. The unit can also behfor hours ordfor days. Note that the total number of data points requested betweenstartandendmust not exceed 4,320. In simpler terms, you can request full-resolution data for a maximum time range of 72 hours. If you need to expand that time range, you must also increase the granularity (i.e., expand the buckets). Here is a general rule of thumb:granularity_minutes ≥ time_range_minutes / max_data_points -
filter: Our filtering solution currently supports the following formats: “errorGroupIdentifier = abc123” or “errorGroupIdentifier IN (abc123, def456)”, where the identifiers are discoverable through our other error group or page endpoints. Because we chose to interpret plain-text filter strings, this property has a lot of headroom for expansion. Let us know what you would like to filter on!
The data returned by the endpoint is in the form of:
[
  {
    "aggregation": "count",
    "metric": "errorInstances",
    "series": [
      {
        "time": "2024-08-15T04:10:03.261Z",
        "value": 0
      },
      ...
    ]
  },
  ...
]You might have noticed that the metrics property in the request body takes an array. That is where you can specify every “column” you want returned.
The value in each series bucket will represent either:
- An integer count,
- Milliseconds (e.g., First Paint time in milliseconds),
- The unit requested (e.g., Cumulative Layout Shift has a set scale),
Depending on the requested metric-aggregation pair.
Visualizing our request
We can use Grafana with an Infinity (or any other plugin that supports REST APIs) data source to visualize the data returned by the error metrics endpoint.
Before we write any queries, let’s make sure Grafana is aware that our minimum granularity (i.e., interval) is 1m:
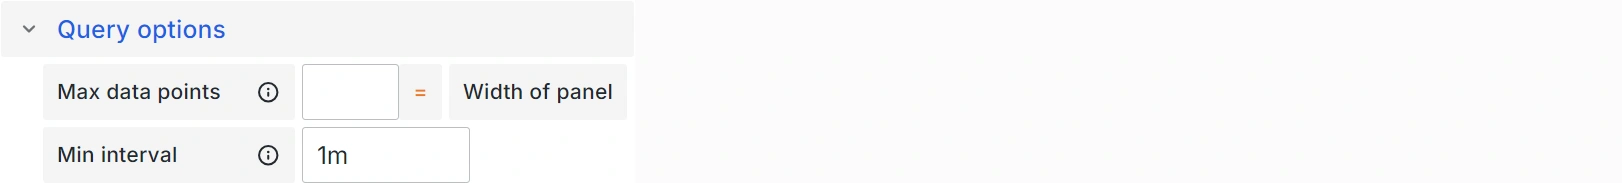
Then, we can add our query. It needs to be configured as a URL POST query that expects JSON.
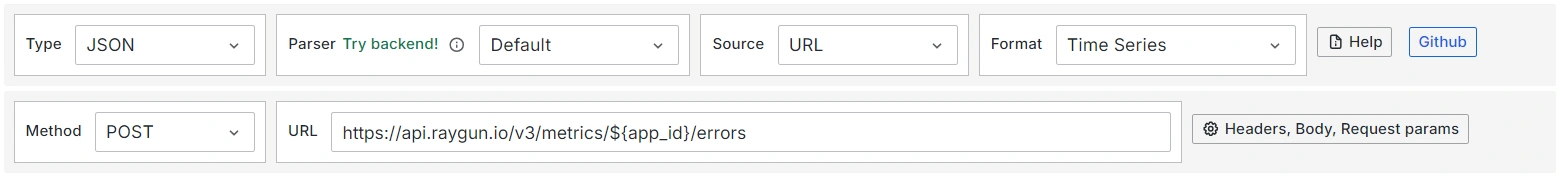
Next, we must configure the query to submit the expected POST body. We can use Grafana variables to set the time range and granularity automatically:
{
"start": "${__from:date :iso}",
"end": "${__to:date :iso}",
"granularity": "${__interval}",
"aggregation": "count",
"metrics": [ "errorInstances" ],
"filter": null
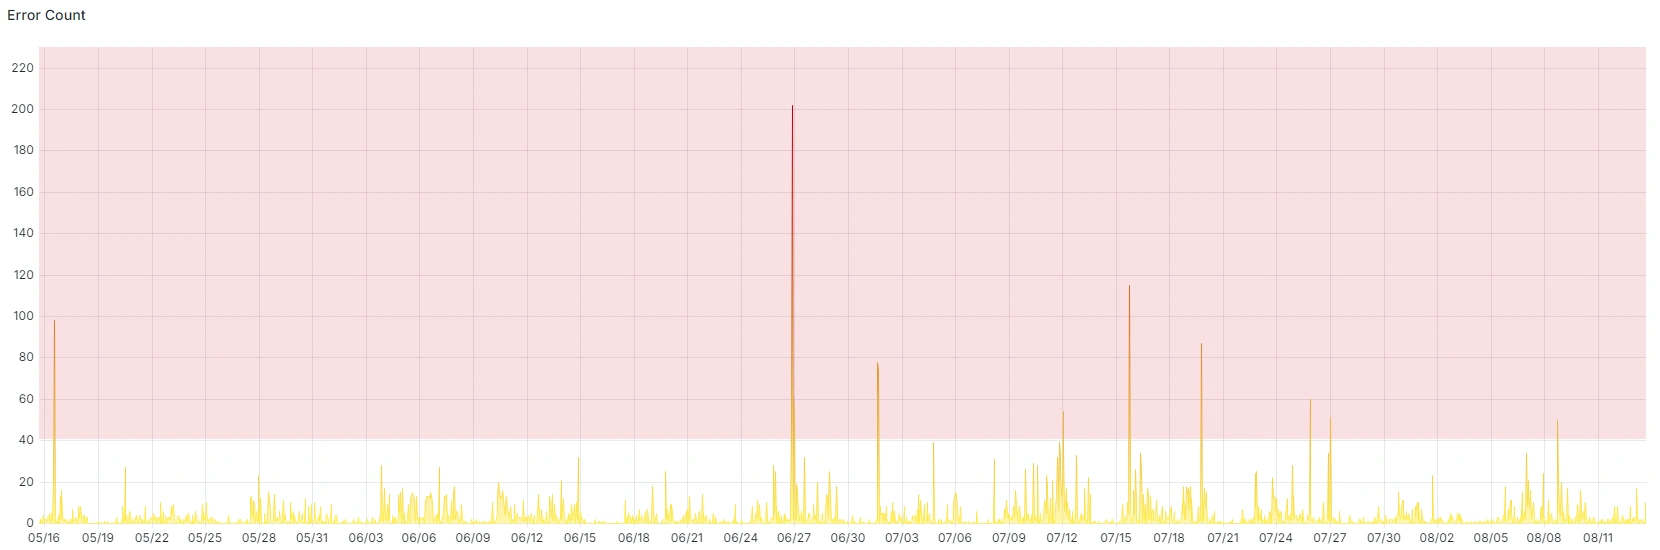
}Finally, we need to configure how we want the data parsed out of the response. Because we just requested one metric, we can grab the first element in the root array.

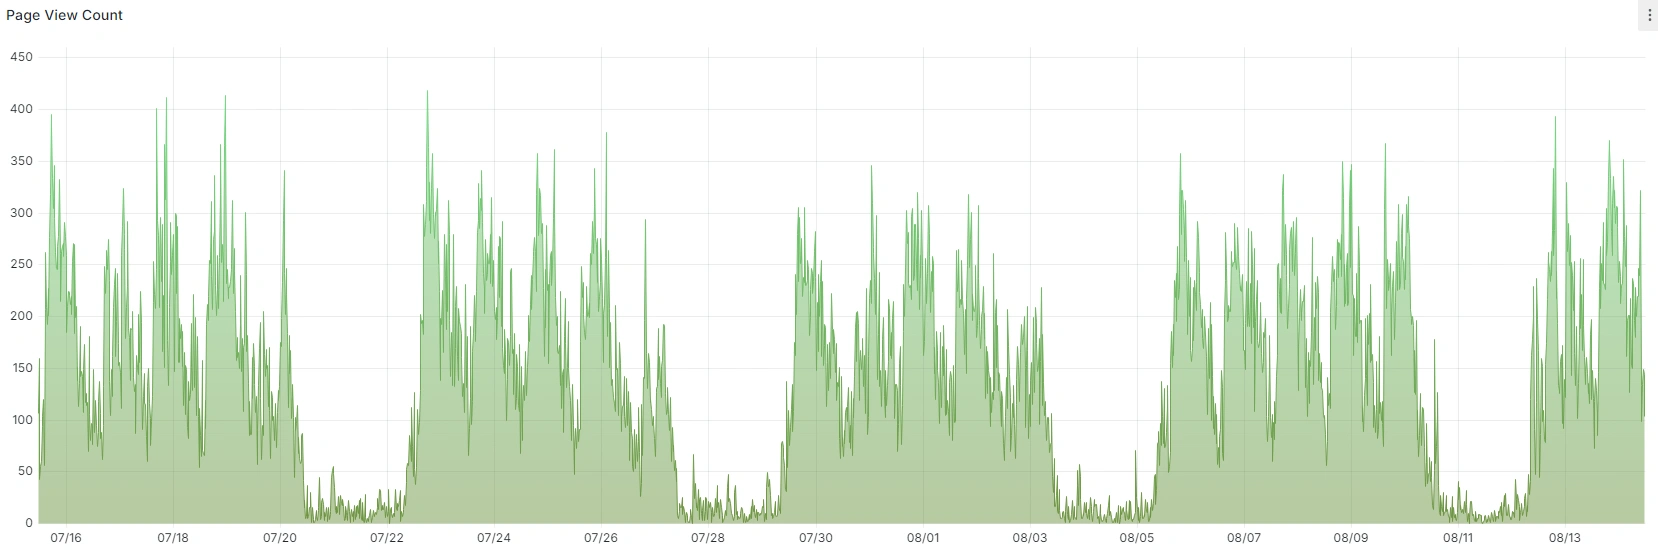
And boom, using that query, we can create a Grafana panel that looks something like this!
Advanced usage
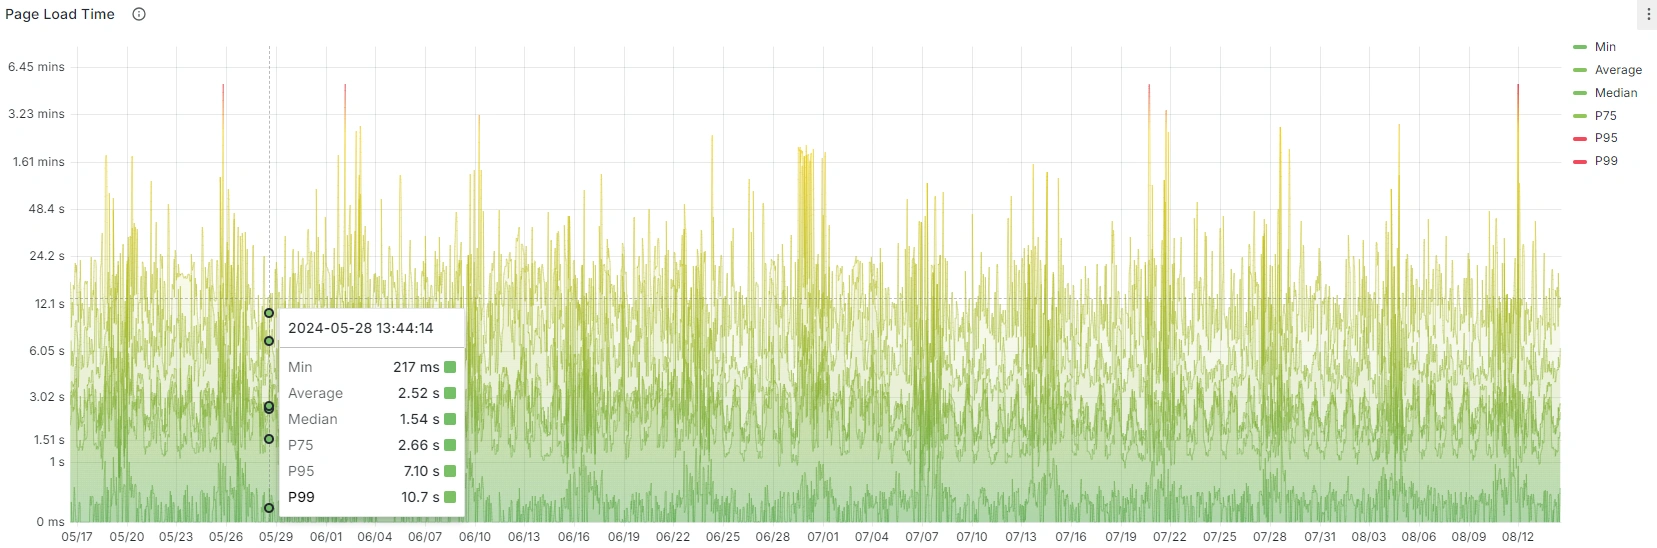
The above examples only scratch the surface of what’s possible through our new metrics endpoints. The page metrics endpoint supports much more functionality at launch, including Core Web Vital metrics. That allows you to build custom panels like these:
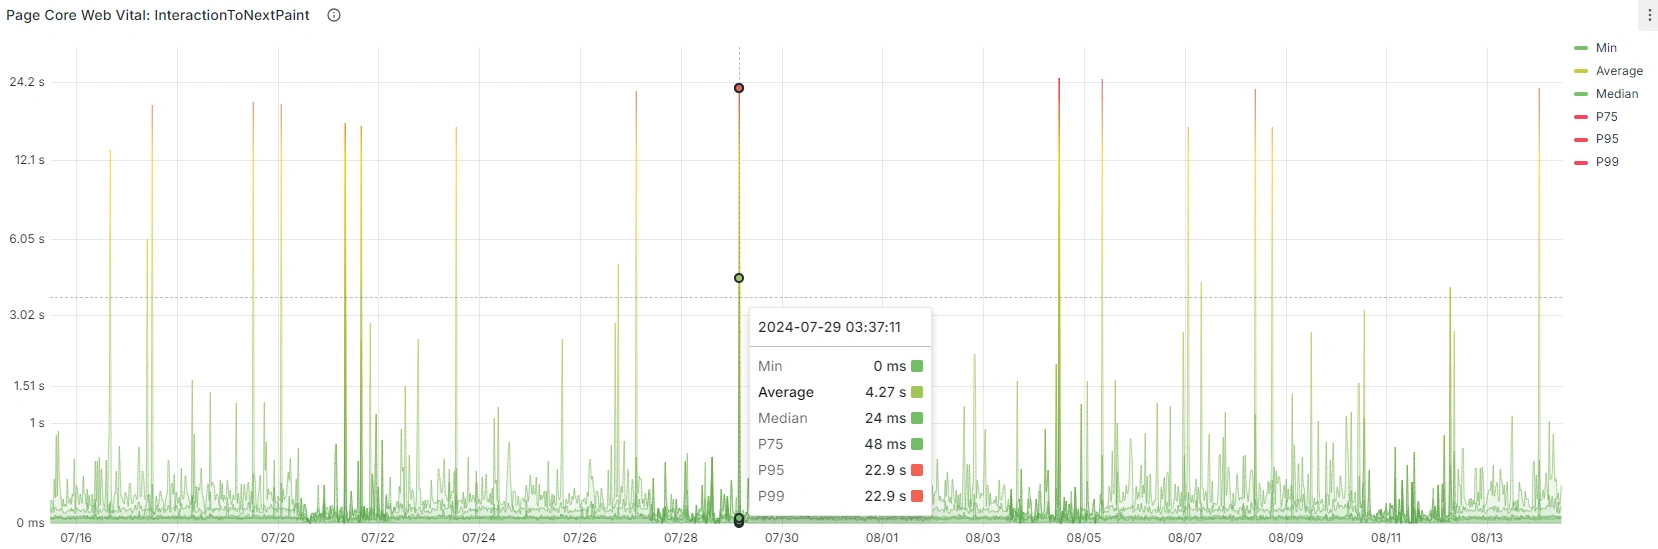
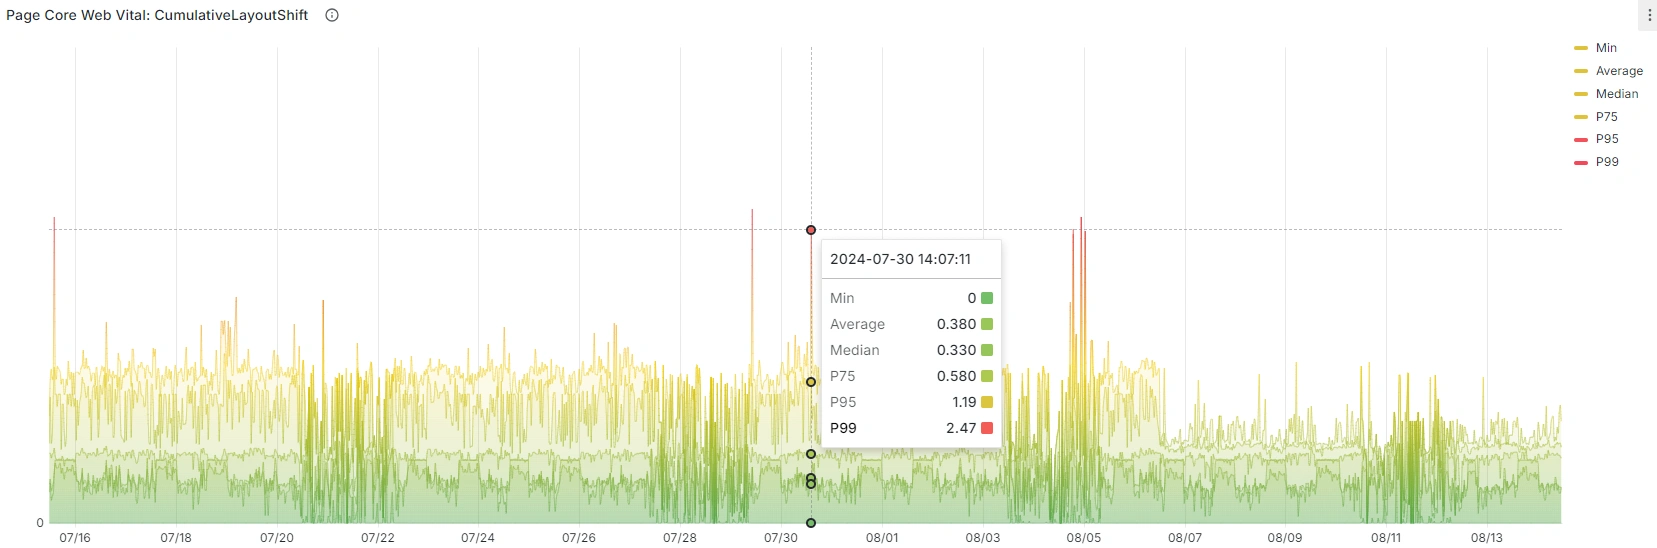
The possibilities are endless from there!
Integration possibilities
Beyond Grafana, our standardized REST API can integrate with various business intelligence and visualization tools. Popular options include Tableau, Power BI, and custom dashboarding solutions. That flexibility allows you to incorporate Raygun metrics into your existing data visualization ecosystem.
Custom metric combinations
One powerful feature of these API endpoints is the ability to combine different metrics and aggregations for deeper insights. For instance, you could correlate error instances with page load times to identify how performance issues affect error rates. You could even correlate those metrics with your company’s system performance metrics from another source. You can now create custom dashboards that provide a more holistic view of your application’s health and performance.
Anomaly detection
Our metrics endpoints enable you to set up advanced custom anomaly detection systems. By analyzing patterns in errors or performance metrics over time, you could create custom alerts for unusual spikes or dips that Raygun does not natively support.
A/B testing analysis
Our API is a valuable tool for A/B testing analysis. You can compare metrics between different versions of a page or application, helping you make data-driven decisions about which changes to implement. For example, compare load times or error rates between versions of a page to see which performs better.
Data analysis
While our API endpoints provide aggregated data, you can export this data for more advanced analysis. Many data scientists and analysts use tools like Python (with libraries such as pandas) or R to perform in-depth statistical analysis. By pulling data from our API into these tools, you can uncover deeper trends, perform predictive analytics, or create custom visualizations beyond what’s possible in standard dashboarding tools.
Custom KPI creation
Combining various metrics available through our API allows you to create custom Key Performance Indicators (KPIs) specific to your business needs. For instance, you might make a “User Experience Score,” combining load time, error rate, and core web vitals into one metric. That allows you to track and report metrics uniquely relevant to your application and business goals.
Of course, every query we performed to create these panels could be filtered to specific pages, allowing for a granular analysis of your application’s performance.
Whether you’re looking to consolidate metrics into an external dashboard, correlate errors and page performance with data points that Raygun cannot see, or perform advanced data analysis, our new API endpoints provide the flexibility and power to support your unique use cases.
Other helpful Raygun API endpoints to explore
Got an endpoint you’d like to see in the Raygun API? Submit your interest here.
See more details on the Raygun API in our documentation. For instructions on how to get started with the API, please visit the beta launch blog, or reach out to our team at support@raygun.com.