Unlock next-level detail in Real User Monitoring with these latest improvements
Posted Apr 8, 2020 | 6 min. (1095 words)In our latest release, we’re rolling out a whole series of improvements to Raygun Real User Monitoring that gives you the instance-level data you need to understand exactly how your application is performing in every single user session.
With the new updates, you’ll be able to:
- Understand exactly how your application performed for every user with instance-level diagnostics on every page request.
- Know where to focus so you can deliver the biggest performance gains with better contextual information.
- Get the most out of RUM with upgrades to our UI.
Armed with this level of diagnostic information, you and your team will know exactly where to spend time when improving the performance of a particular page.
We’ve made a big batch of updates, so make sure to watch the video from our Product Manager Nicholas below for some added context. Otherwise, read on for the details!
More context with the histogram drill-in
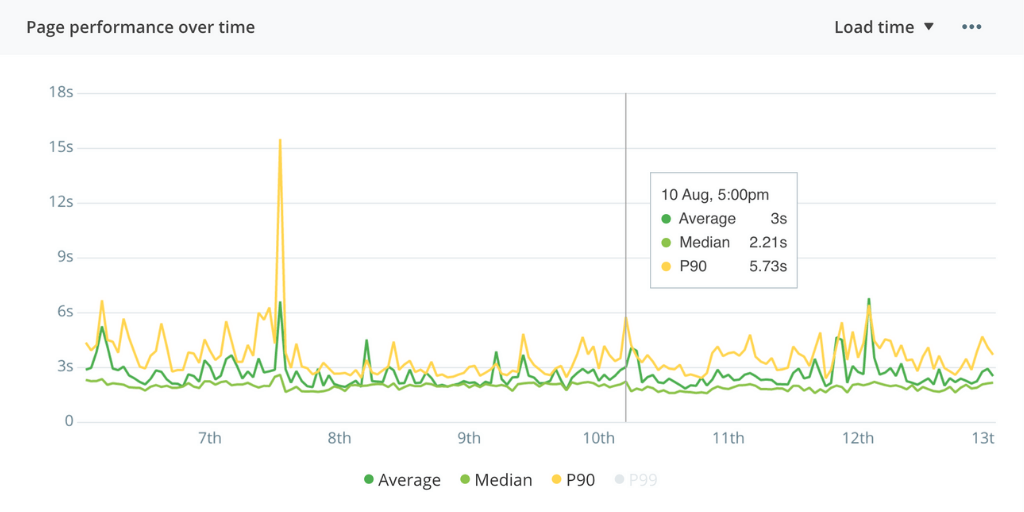
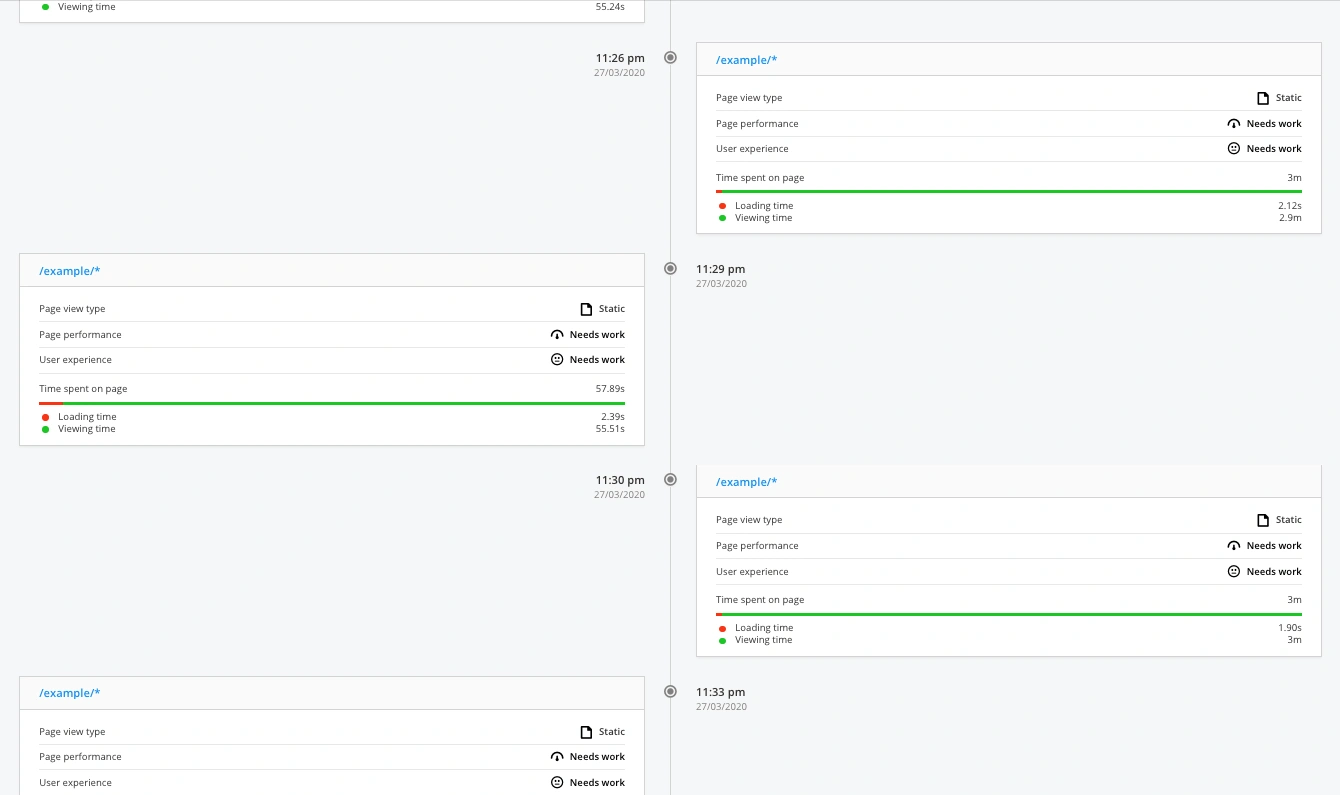
Let’s start with the histogram improvements. You may have already seen the histogram bars, which visualize the distribution of page performance. You can now click into any bar on the histogram to reveal the session with views of that page within the time range represented by the bar:
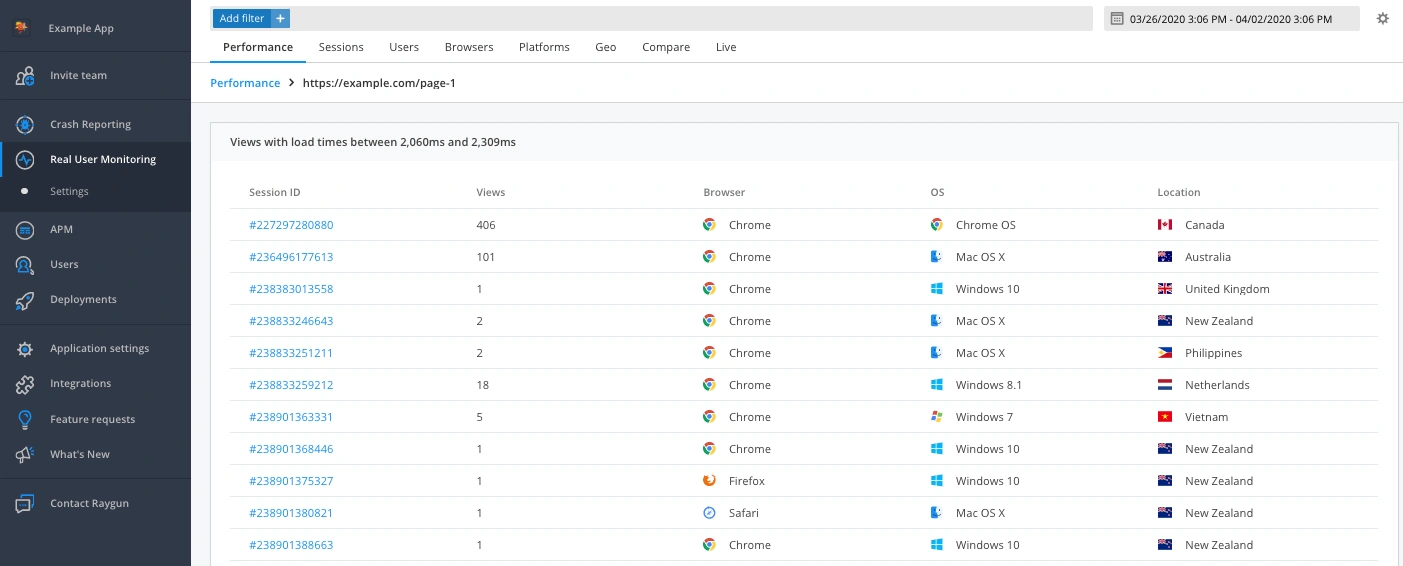
The number of views of the page within that session, browser, OS, and location information is all right there in one view.
Now that we’ve drilled into the first layer of page performance, you may be wondering what happened in those sessions? That’s where the instance-level data comes in.
More granular diagnostics with instance-level data
Real User Monitoring helps you to understand the performance of your application so you can improve and optimize the user experience. With these changes, we’ve added deeper diagnostics on every page request in a user session.
Now, when you click into a page request from the user session view, you are presented with an instance-level view of page performance. These granular diagnostics show the performance of that specific page request. The instance-level diagnostics provided include:
- Key contextual information about the request, like the geography, browser, device, and operating system.
- The load time breakdown of this page, showing you how much time was attributed to the different portions of load time (network, server time, client time).
- The waterfall time, showing you all requests made to load that page, and how long each one took, for that specific page request.
- A list of XHR requests made from that page, and how long each one took to respond.
The waterfall chart provides invaluable insights into the slowest loading requests on a page, helping you to understand where to focus to improve the performance of this page. That’s why we added some nifty UX improvements to the waterfall chart to help with your performance investigations.
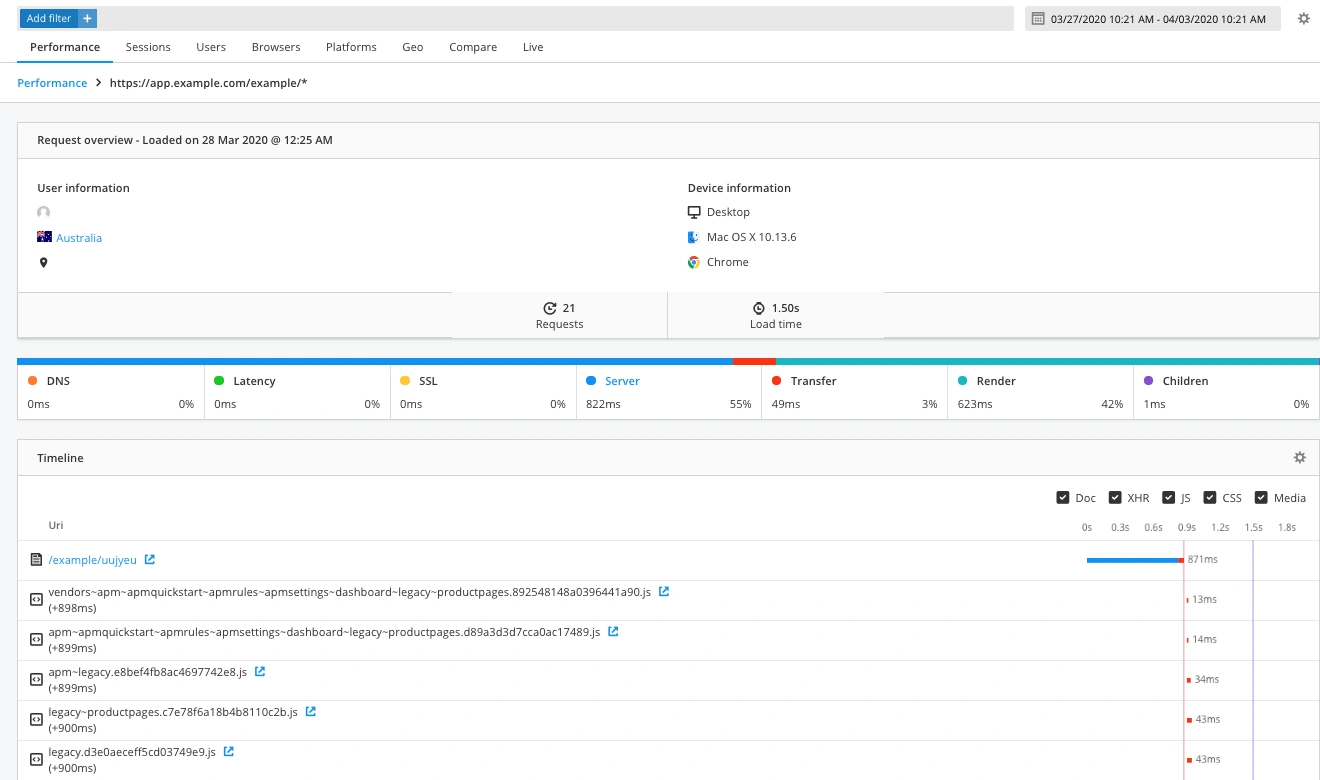
Toggles give you more control to show or hide different request types (Doc, XHR, JavaScript, CSS, and mobile requests) in the waterfall timeline, helping you focus your investigations. This also gives you an experience consistent to the network timeline in your browser dev tools.
Added offset timings to show the point in overall load time where a particular request was made. This allows you to determine whether requests are loading asynchronously or not, and also to understand if the host connection limits are impacting your load timeline.
Instance-level Real User Monitoring data means we can now link to instance-level APM data. With Raygun APM enabled, you can click on the ‘Server’ block on the request details page, which will take you to the exact trace for the specific page request. This allows you to understand exactly what caused a slow server time, and how to optimize for better server-side performance. (Note that this is available for .NET only at the time of publishing.)
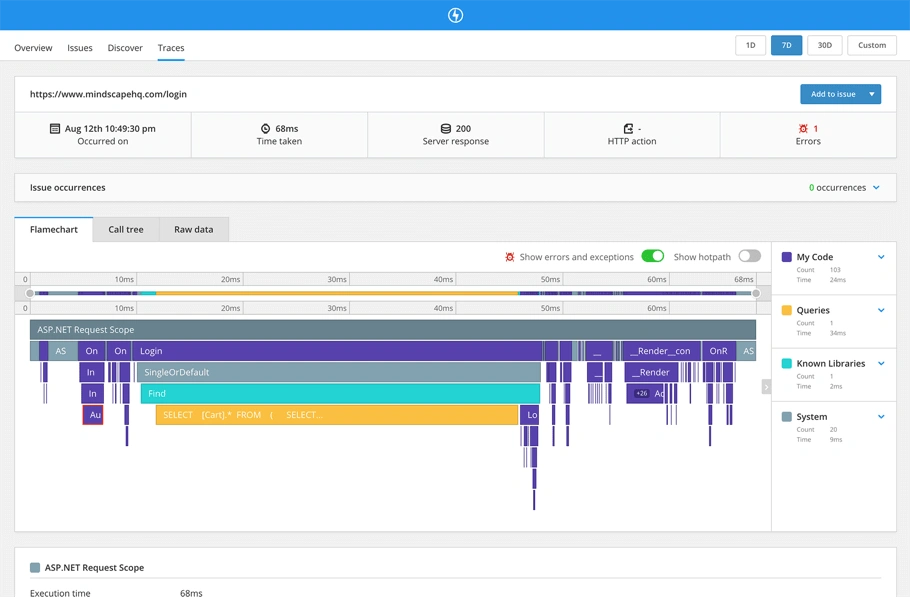
The best part of these changes is that you are seeing your application from your user’s perspective. Every time you make an improvement, you can directly measure the impact of that change on your customer’s digital experience — and we think that’s pretty cool.
Relevant performance data at your fingertips
If you’ve been following along with Real User Monitoring over the last few months, you will notice that we have placed a lot of emphasis on the user experience of the product. Why? When it comes to performance improvements, we know that seconds saved today mean hours saved over a month. So, we’re on a mission to make RUM faster and easier to use. Read on for the latest improvements to the RUM UI.
Upgrades to the main performance page
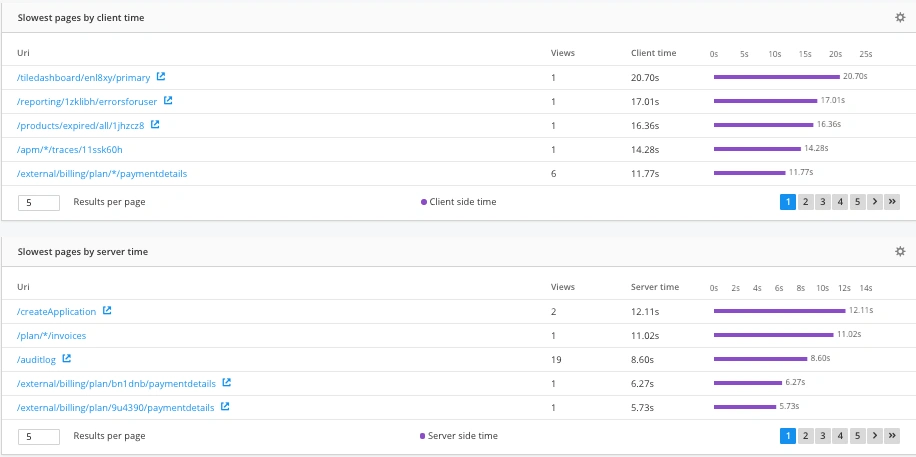
We’ve added two new sections to the main performance page which adds another method for people to identify slow loading pages. On the Performance page in RUM, scroll down to discover new charts that surface the slowest pages by server time and slowest pages by client time.
Updates for internally facing apps
We know many customers have internally facing apps like employee portals that still need performance monitoring. So we’re adding a new chart to the main performance page titled Active Users. If you aren’t adding new users all the time, this section enables you to give your most active users a great user experience.
Choose which modules to display
At a user level, you can now choose which modules you’d like to display in Raygun, and which you’d like to hide. These controls can be found in the Real User Monitoring settings in the sidebar.
Response codes support
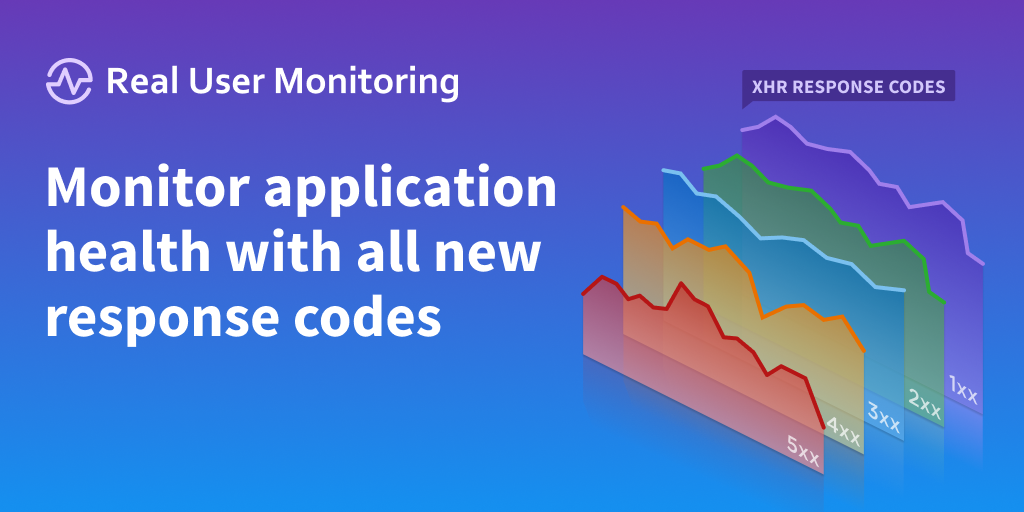
In our latest release, we are an all-new section to Real User Monitoring to provide another way for you to monitor application health; the Response Codes tab. Real User Monitoring now tracks the response codes from XHR/AJAX calls made in your web application using the JavaScript provider. Read more on the blog here.
More visibility with deeper diagnostics
We know that was a lot, so thanks for reading so far. We’re really proud to bring such a big batch of updates to you. As you can see, we’ve been working hard behind the scenes to ensure Real User Monitoring provides the most detailed performance diagnostics on the market today.
With instance-level visibility into what happened in every single page request, developers now have all they need to diagnose exactly what is causing poor performance or see what happened on individual requests for a user having an issue.
Are you interested in the updates we are making to Real User Monitoring? We’d love to hear your feedback. Get in touch with suggestions.
Or, if you haven’t tried Real User Monitoring yet, we have a 14-day trial where you can try all the new features. Sign up here for free.
