Server monitoring best practices: 9 dos and don'ts
Posted Aug 29, 2018 | 10 min. (2003 words)Have you ever had responsibility for an application and been the last to know about an outage? I have, and it’s terrible.
You go to check your phone in the morning over coffee, after waking up, and you see a flood of missed calls and tons of emails. Customers are angry. Your boss is demanding to know what’s happening. Even the company’s executives are involved. How did this happen?
Believe it or not, this sort of thing used to be surprisingly commonplace. That was in the days before server monitoring using an Application Performance Monitoring tool became as mainstream as it is today.
Diagnose errors and performance problems right down to the line of code with Raygun.
These days, no doubt you have at least some kind of monitoring in place to get out in front of things. If not, then the first tip is an easy one: start monitoring your production applications.
But assuming you’re doing at least something, let’s look at how you can improve. What is a server monitoring best practice, and how can you use such practices to make your life easier?
Maintaining server health
To understand both server monitoring and its related best practices, you need to understand the concept of server health. Servers don’t exist in some kind of simple binary state of “up” or “down” where they’re fine as long as they’re not offline. If that were the case, you could just write a little script to ping your server once per second or so, and email you if it went down for any length of time.
But it’s not that simple.
Servers can get into states where they respond to all requests correctly, but do so extremely slowly. They can exhibit intermittent performance problems or partial outages. And problems can crop up at the physical, virtual, operating system, web server, or application levels, leading to a wide variety of problem scenarios.
Put another way, like human beings, servers can become unhealthy in all sorts of ways. And, like human beings, they require intelligent monitoring in order to stay healthy.
So let’s look at some server monitoring best practices that help promote and maintain server health.
1. Don’t: Hand-roll your own solution
In the IT world, there’s an idea known as “not invented here syndrome.” It describes our natural tendency to prefer building our own versions of things, rather than making use of existing ones.
And, while build versus buy is a reasonable debate to have in many contexts, I assure you that server monitoring isn’t one of them. Building internal tools could be a costly mistake, especially when sensitive data is involved.
It wouldn’t occur to you to write a logger from scratch, would it? Do you build your own source control tool every time you take on a new project, or your own web server and operating system to deploy things? I certainly hope not.
In today’s world, you should think of server monitoring software this way. This is a well-solved problem with affordable solutions at your disposal. Definitely use them.
2. Do: Set up a clear, visual representation of your servers
Now that you’ve rolled your sleeves down and backed away from scripting your own monitoring tools, let’s look at something you should get out of these tools. You should get clear, visual representation of key data and metrics representing server health.
To understand why, think of driving in your car. You have a dashboard that offers critical information to you: current speed, fuel level, RPMs, etc. And as part of that dashboard, you have a series of lights and indicators that tell you when you might have problems, like a flat tire or engine problems.
This combination of clear summary and visual representation allows everyone from laypeople to mechanics the ability to make intelligent decisions about the car. Contrast that with a car dashboard that just had a scrolling wall of text containing temperature readings, trouble codes, and the like. Even if you knew how to read that, it’d be a chore, and you probably wouldn’t do it as much as you should.
So make sure that monitoring your server includes a clear, uncluttered visual representation of server health.
3. Don’t: Rely on people to log in and check
Now that you’ve found your tool, set it up, and configured it to give you nice visual reads on your servers’ health, you might think that you’re doing pretty well at server monitoring in general. But you’re not done. Getting that information in one place is great, but you also need to get the information to people.
Now, I can imagine what you’re wondering. “If it’s right there in the dashboard, they can log in any time they want and look. Why would we get information to them?”
I can answer this in two main ways. First, asking someone to log in and check a bunch of things, looking for problems, is more error-prone. And second, a person having to log into something makes them a lot less efficient than having that same person receive a directed message.
So rather than asking people to keep an eye on the system, make use of alerts.
4. Do: Set up detailed, well-structured alerts
Of course, you’re not done there. Setting up alerts is an important step and a huge improvement from asking people to laboriously monitor servers. But not all alerts are created equal.
A good alert needs to be clear and actionable for the person receiving it. So when setting up alerts, think through who will get it, how important it will be for them, and what they’ll do next. Thus, a good, well-structured alert should include the following:
- What is the severity of this issue?
- What are the logical implications—who or what is affected?
- What is the critical, relevant data that triggered the alert?
- What should the person receiving the alert do next? (Preferably, link to a recommended procedure)
If you think about these things while setting up your alerts and the condition that triggers them, you’re far more likely to have alerts that result in quick resolutions to problems.
5. Don’t: Just use email for alert notifications
Part and parcel with understanding what makes for a good alert is understanding what doesn’t make a good alert.
When it comes to alerts, more isn’t always better. You want to have a high signal to noise ratio—you get the information you need without the burden of information that you don’t care about.
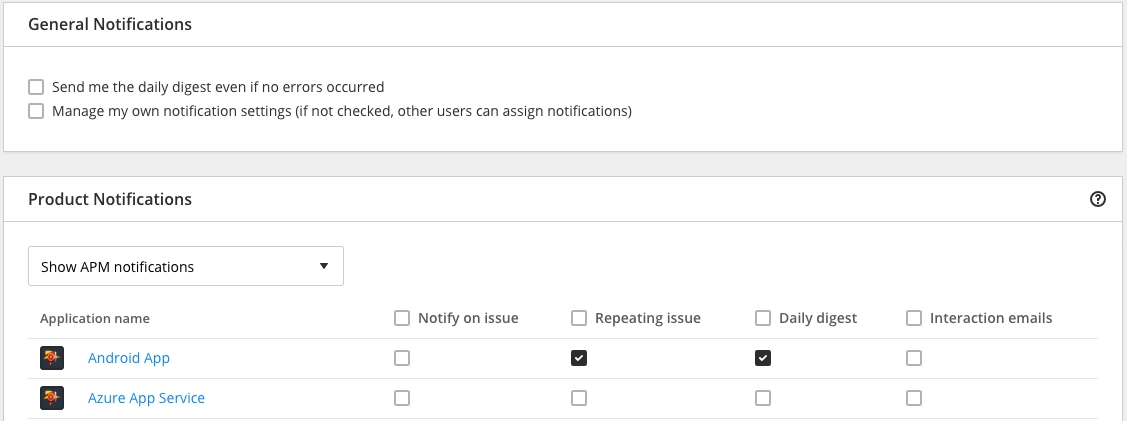
An APM tool like Raygun can help you manage your notifications:
At the end of the day, you want to avoid doing anything that causes people to ignore any alerts. Every alert that anyone receives should be important and non-redundant.
6. Do: Monitor server health from several sources simultaneously
Switching gears a little, let’s look at a different aspect of server monitoring. Any list of server monitoring best practices should include a way to avoid false positives. In this case, I’m talking about monitoring your application from several different locations or providers.
To understand why, imagine the following scenario. Let’s say that you have a monitoring tool in Asia and that your service is hosted in North America. If your monitoring tool loses communication with your server, it will start to alert you that the server is down.
But do you really know that you’re down? What if some node along that long path just went out, and a good chunk of the world can still use your service? The outage is a problem—but it’s not your problem, exactly. It’s certainly not actionable for you.
So make sure that all monitoring you’re doing is sophisticated enough to account for individual outages or nodes going down.
7. Don’t: Assume that no news is good news
Here’s a trap that you can fall into once you’ve had your monitoring in place for a while. You can start to assume that no news is good news.
Now, this may sound weird. Because the fact is that, in short bursts, no news is good news. And while no news is also theoretically good news over the long haul, there’s a serious caveat there. Systems will have problems. It’s not realistic to expect to have no issues for weeks or months.
So if you find that weeks or months have gone by, and you haven’t heard a peep from your alerting scheme, you should become wary. You should start to suspect that there is at least one problem, and that problem is whether your monitoring software is on and properly configured.
Going back to the previous car analogy, imagine driving your car for months or years and never receiving any feedback. No check-engine, no windshield washer fluid indicator, no low gas light. Would you assume that your car was some kind of magic car, or would you think that perhaps the warning light system was broken?
So it goes with your server monitoring software.
8. Do: Enhance your server monitoring with good operations practices
Server monitoring is a powerful tool in your arsenal, but it’s not enough all by itself. It can tell you if your microservice has just started kicking out tons of error messages or if something is spiking the CPU. But it’s not going to dive in and tell you what, why, and how to fix it. You’re still going to need human intervention for that.
So make sure you’re doing everything you can to make troubleshooting easier. Use structured logging everywhere you can to ensure that you can easily search and make sense of relevant logs. Instrument your application so that you can automatically flip over to debug mode when metrics start to indicate an unhealthy server. Anything you can do to surface more information and make that information accessible will help tremendously.
9. Don’t: Use overly simple metrics
Last up, consider what I’ll call the metrics trap. Don’t let yourself be fooled by overly simplified server metrics. To clarify what I mean, I’ll use a simple hypothetical example.
Let’s say that you had a public facing API that processed some computationally intense requests, and you wanted to ensure that it was doing its part to provide a good user experience. Ideally, you’d like it to process its requests in less than a second, and it’s worth alerting you if the average processing time becomes more than three seconds. So you setup an alert accordingly.
Now, let’s say that in production, the API actually does really well most of the time. For 90 of the first 100 requests coming in, it processes them in 0.5 seconds each. That’s great! But, for the other 10 requests, it takes 20 seconds each. This situation still results in an average processing time of 2.45 seconds, even though 10% of your users are having an absolutely atrocious experience.
This is a hypothetical, so I can’t really give you an exact right answer. But what I can do is tell you to avoid oversimplifying with something like a simple average. Make sure you’re really thinking through your alerting conditions and everything that would constitute unacceptable performance.
Get started with server monitoring ASAP
All of these best practices will definitely make your life easier as you implement server monitoring, whether you’re monitoring a physical machine, an operating system, your web app, or all of the above. And to do that, you have a variety of server monitoring tools from which to choose.
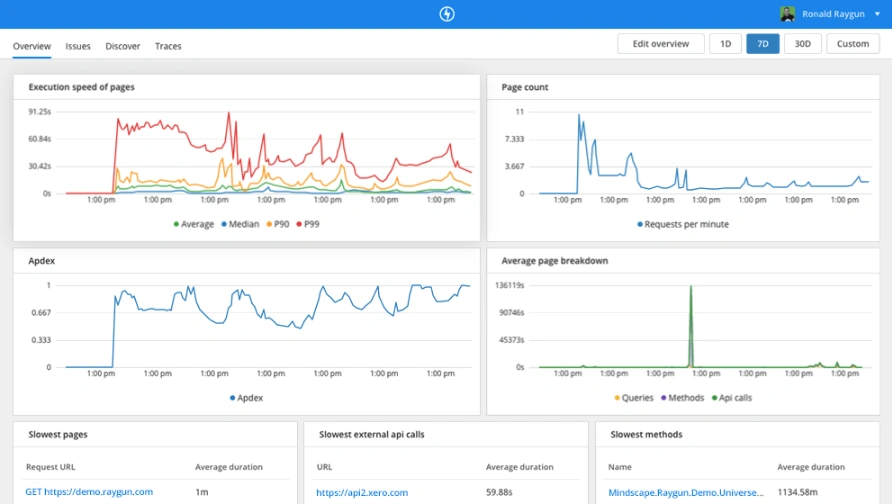
APM is the best tool to monitor server health, as they give teams visibility into problems. With Raygun’s APM tool, you can drill down into the line of code, function, database, or API call that causes a problem.
A decade ago, I could sort of get away with being the last to know about an outage. In this day and age, you definitely cannot, so make sure that this doesn’t happen to you.