How we scale Raygun's architecture to handle more data
Posted Aug 25, 2020 | 5 min. (988 words)Due to the huge importance of sourcemaps in the workflow of our customers, sourcemaps are a crucial part of our Crash Reporting offering.
We constantly strive to stay ahead of our customer demands as the amount of data we process continues to grow. We identified the sourcemapping process as an area ripe for performance improvement, so we took it apart and looked at exciting ways to build it from the ground-up using cutting-edge tech. Our key objectives were: horizontal scalability, blazingly fast processing rates and easy monitorability.
A quick background of sourcemaps
Skip ahead if you’re familiar with JavaScript sourcemaps already. 😀
Sourcemaps are an essential part of the JavaScript debugging process. A sourcemap is essentially a JSON file containing the instructions used to piece together JavaScript code which has been compressed (or minified) down for optimal performance. A major proportion of the total Crash Reports which Raygun processes are from JavaScript, and nearly all JavaScript running in production these days is compressed (commonly by a tool like UglifyJS).
This presents an interesting problem; if your production code is compressed, how are you going to know exactly where an error occurred when reading an error stacktrace? This is where our sourcemaps worker comes into play. It processes hundreds of millions of these compressed JavaScript files every month in order for customers to be able to easily debug their JS errors.
Without sourcemaps
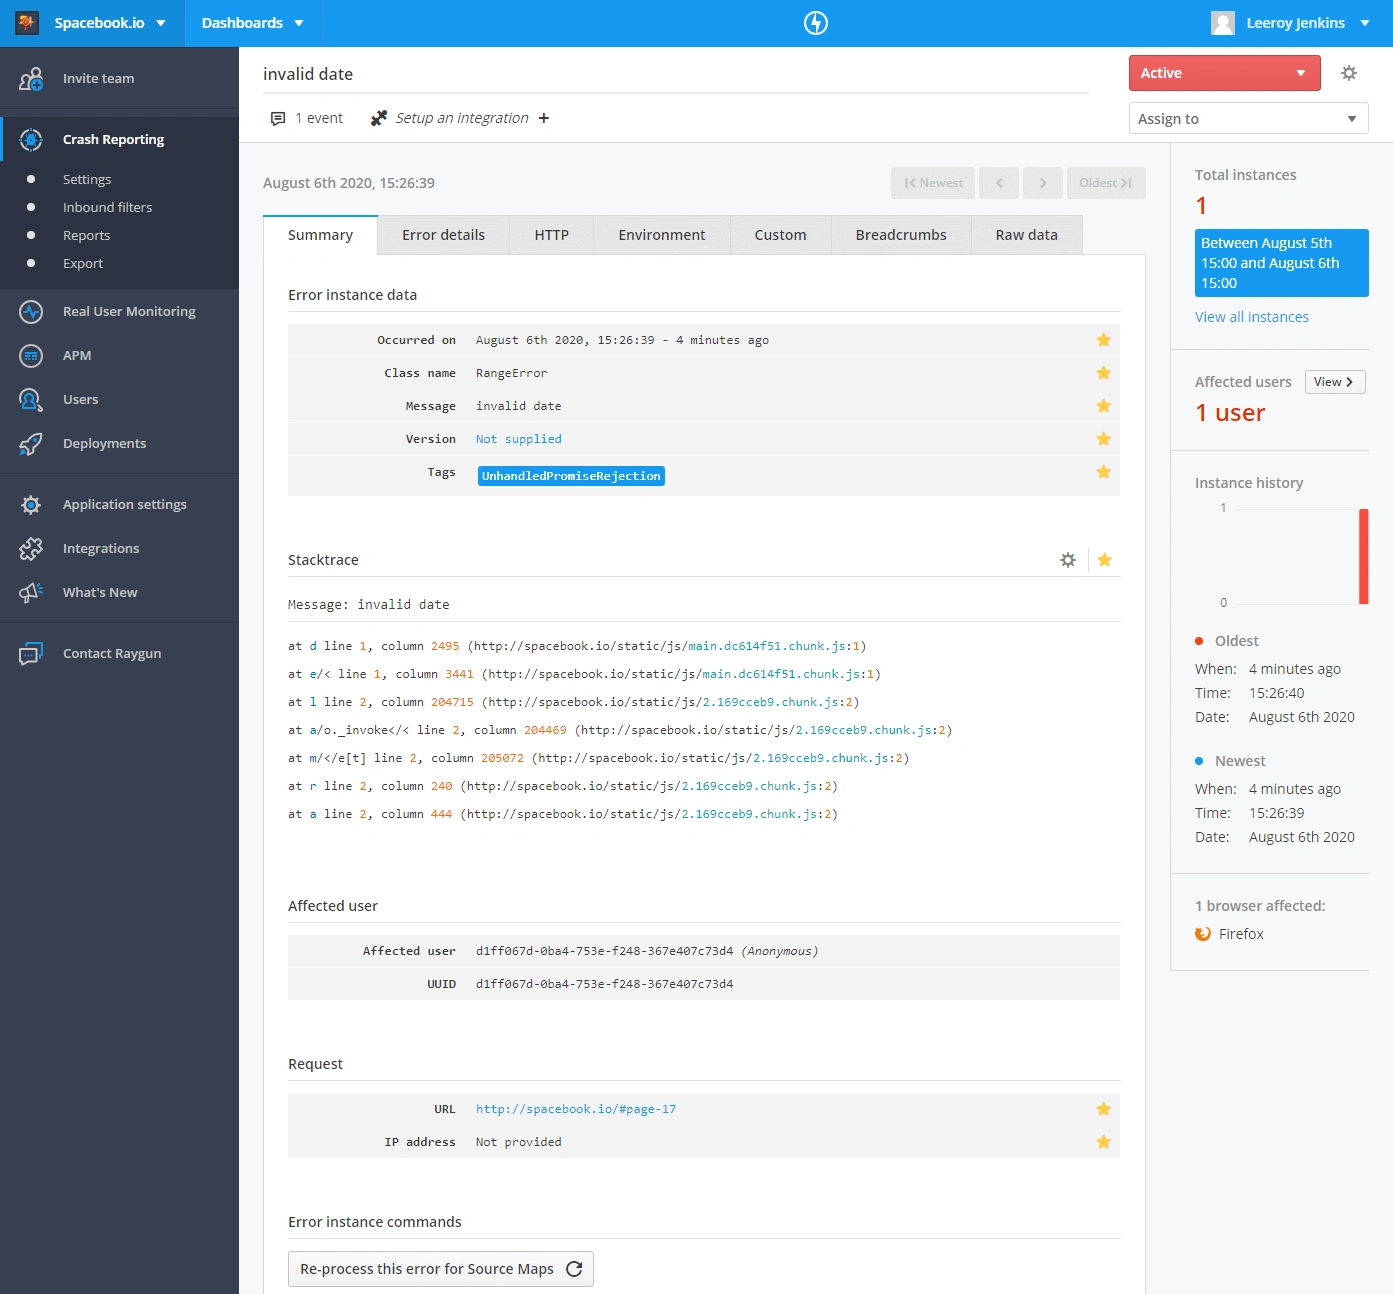
- Suspiciously low line numbers
- Uncomfortably high column numbers
- Cryptic function names
- Obscure file names generated by webpack
😱 JavaScript is difficult enough at the best of times, trying to debug without sourcemaps is extremely difficult and time-consuming!
With sourcemaps
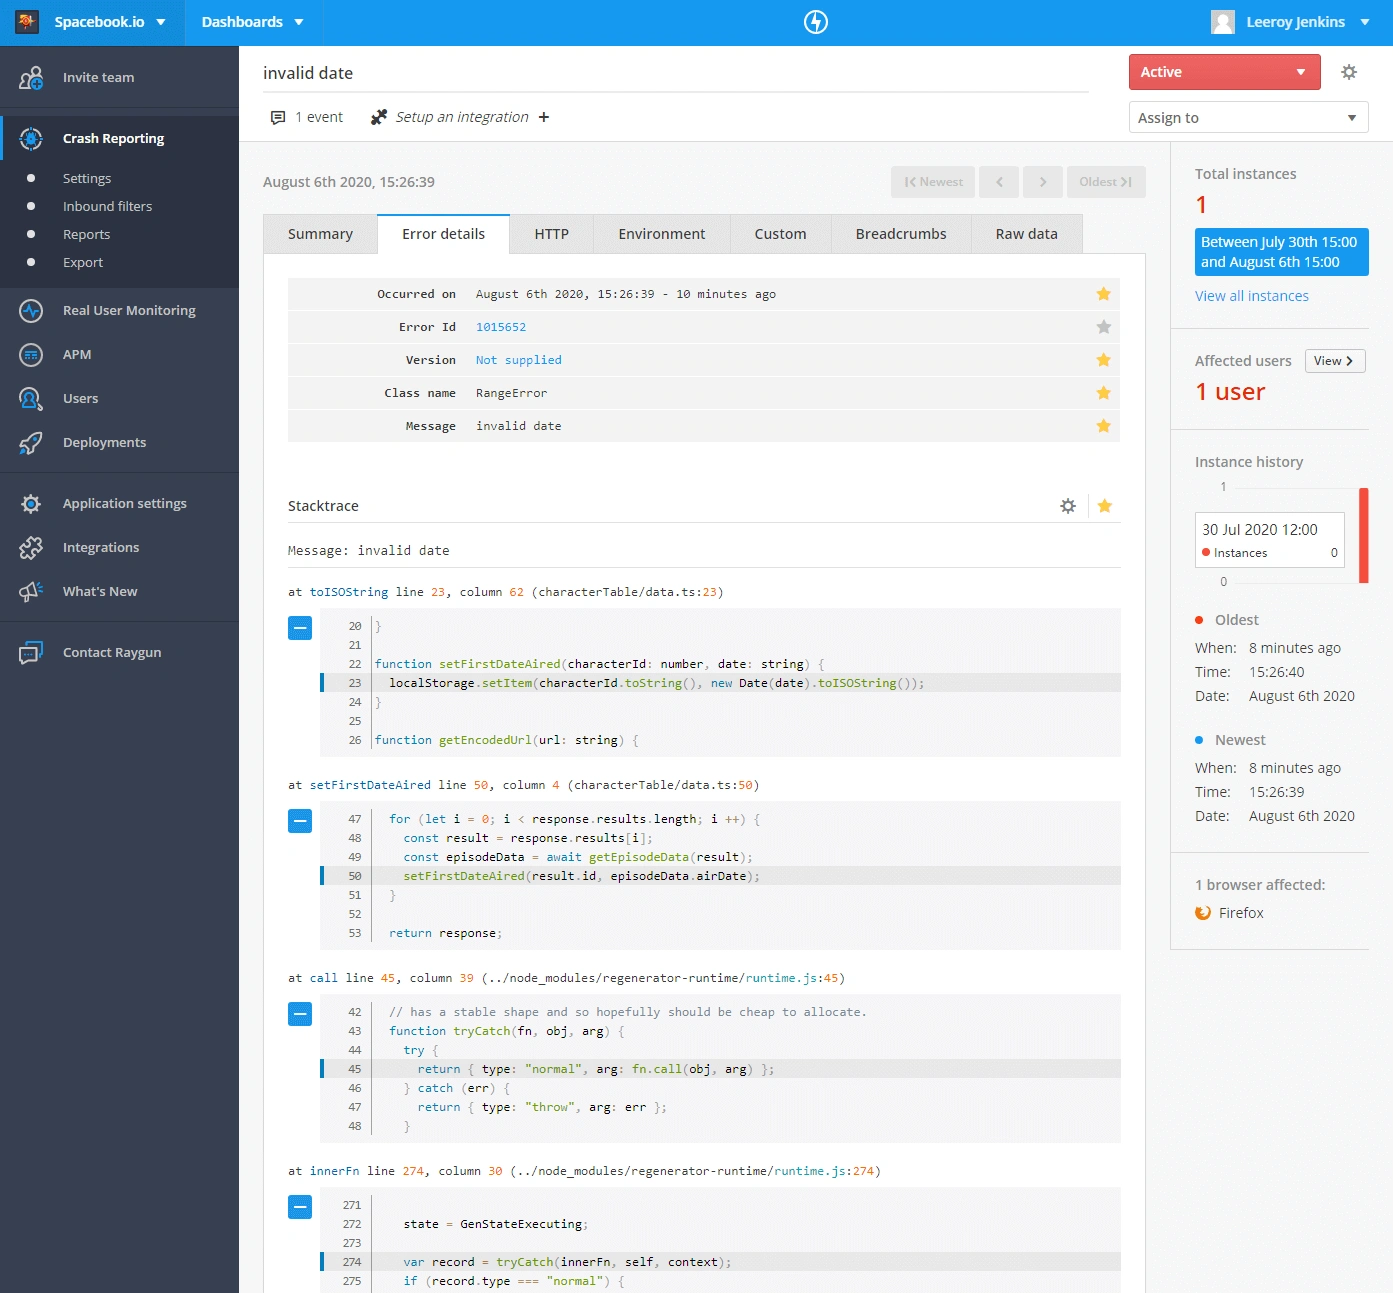
- The function name is clear
- Actual line and column numbers which the error occurred on in your code!
- A code snippet showing the code in context
- An engineer can look at this and know exactly where in the source code the error occurred and fix the problem immediately!
Why .NET Core?
We’d already seen some big performance improvements using APM to monitor our .NET Core 2 apps, so we knew .NET Core was the right direction to move forward. With the release of .NET Core 3, we saw even more big wins regarding performance which we would get out-of-the-box.
The announcement of .NET 5 was another sign that migrating to .NET Core was definitely a move in the right direction and would help us to stay up to date with changes in the .NET space.
Scalable architecture
Cross-platform support in .NET Core means we can run our worker on Linux and therefore deploy as an auto-scaling group, which is the first step towards solving the issue of horizontal scalability.
The next part of the challenge is in how the code is structured. We followed a modular approach, with each module only doing a small part of the work before passing the data off to the next module via internal queues.
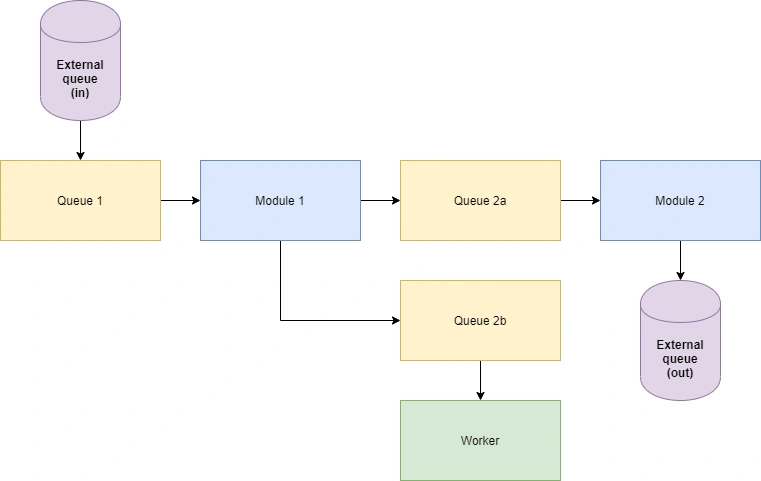 This oversimplified diagram illustrates the basic concept. Internal queues carry data from module to module, this structure also allows queues to branch off to send data to external workers.
The role of monitoring
During soak testing, Raygun Crash Reporting was immensely helpful in notifying us of exceptions and memory issues. It helps us to pin down issues occurring in a particular module. We can easily attach metadata to an exception, allowing us to find exceptions associated with a particular application or error group.
To monitor performance metrics, we used Datadog. Granular controls allow us to build a dashboard with separate sections for each module. We can watch the data flowing through the worker, quickly spot large spikes in processing times, check cache effectiveness and identify some high-level performance issues. It also allows us to monitor CPU, memory and disk usage.
The results
Reduced costs
By moving from .NET 4.7 to .NET Core 3, we were also able to move from running a handful of expensive Windows servers to a single Linux server in an auto-scaling group. This had a dramatic impact on our server hosting bill.
More efficient storage meant we were able to delete a huge amount (~32TB) of data in storage, making another dent on our monthly bill.
Higher code quality
The new architecture provides us with distinct modules that have well-defined responsibilities and so are easier to unit test. Thoroughly unit tested code is great for the developer experience and helps improve maintainability. The new worker is also a lot more extensible; new modules can be easily added without impacting the existing modules.
Increased throughput
Our module-based architecture, coupled with the natural performance increase of .NET Core 3 means that we are able to dramatically increase the capacity for how much data can be processed. This allows us to stay on top of customer demand as the number of JavaScript crash reports we need to process continues to grow.
Reduce the area of concern
By making the worker more efficient, we can decrease the number of servers to one while processing even more data! This not only has the economical benefit mentioned above, it also significantly reduces the area of concern.
If in future we do need to scale up the number of workers to accommodate an increase in demand, we can. Multiple servers need to be kept synchronized and work needs to be balanced across the servers. We’ve factored this in, so each instance can process independent pieces of work and won’t duplicate processing across instances. The new instances also share a centralized caching layer for increased efficiency.
What’s next for Raygun’s architecture?
In the future we plan to migrate more of our infrastructure to .NET Core, following the same process and architecture as what we have built for processing sourcemaps. It’s been a great opportunity to find novel ways to use our own products to monitor errors and performance. Now, our team can iterate faster and with a high level of confidence, which is essential in the ever-changing world of JavaScript tooling.

![.NET Core or Node.js? [We increased throughput by 2,000%] featured image.](/blog/wp-content/uploads/2017/05/net-Raygun-um.png)