Feature update: Improvements to Raygun’s Usage page navigation
Posted Feb 13, 2017 | 2 min. (344 words)Note: this feature does not apply to legacy accounts.
Have you ever wondered which of your applications are contributing to the largest amount of errors?
In 2016 we added the “Usage” tab inside your plan settings page, which tells plan owners which of your applications are using the most amount of your monthly errors/sessions.
This feature made it much easier to identify your buggiest apps, as well as helping you better manage your Raygun subscription.
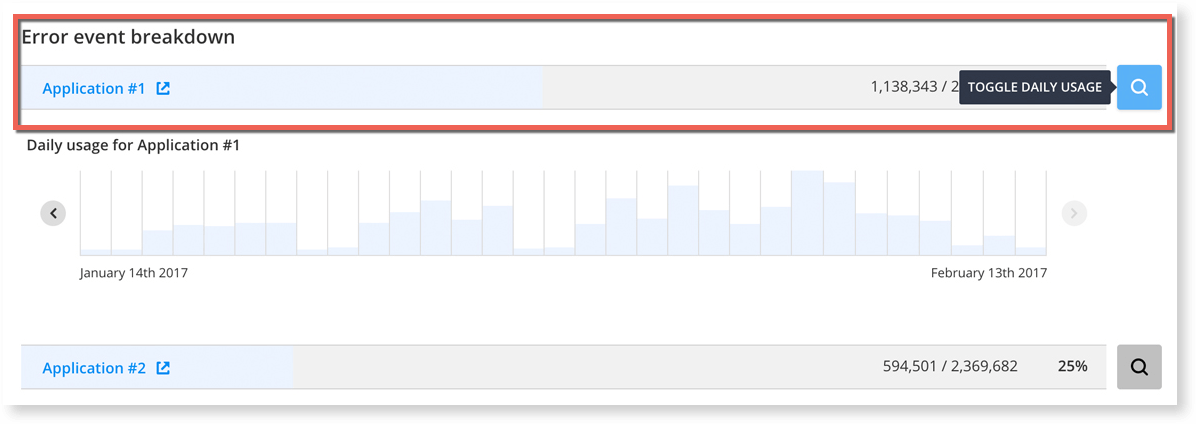
We’ve made this feature even better by introducing the daily usage graph for each of your applications. With this graph, you can see your error volume/session count on a daily basis, which is helpful in understanding how spikes and outliers affect your applications at a granular level. It’s also great for understanding if you need to start resolving active issues or if these are errors which you no longer wish to track.
We also added a warning to alert you to when you are nearing your error quota, so you don’t run over your account allowance.
Getting started with the improved Usage page
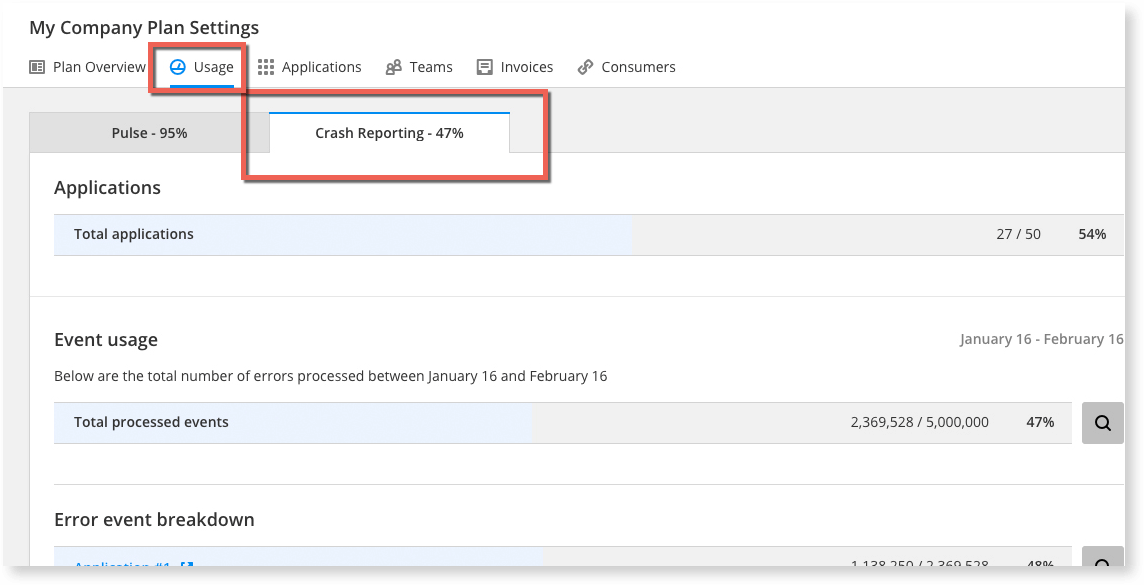
Head to your username located in the top right corner of your Raygun dashboard. Navigate to the connected plan for which you need to see your usage.
From here, select the ‘Usage’ page. On this page you can view your total usage for the month for both Raygun Crash Reporting and Raygun Pulse. The total error summary breakdown by application is shown when you select your tab:
Improved navigation to the ‘Session breakdown’ view
Click on the magnifying glass icon to the right of the application which will take you to the ‘Session breakdown’ view:

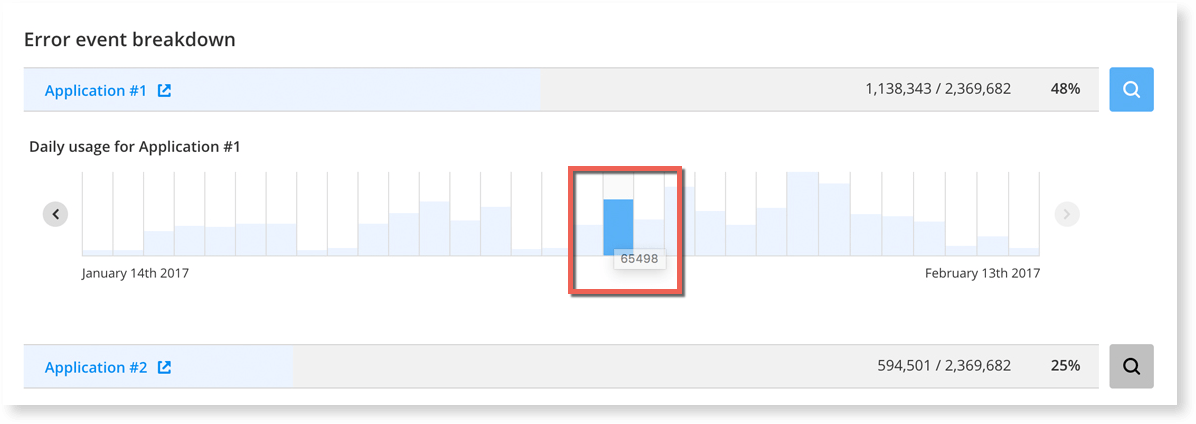
You can then hover your mouse over any bar to discover the total processed events for that application:

Total processed error warning
If you hit your monthly allocation of errors, a warning will come up with details on how to upgrade:

Do you have any questions?
Do you need help upgrading your plan or have any questions about the Raygun’s ‘Usage’ page? Get in touch with a friendly team member here.
