Using observability tools for security monitoring and incident detection
Posted Feb 20, 2025 | 4 min. (732 words)Most security teams overlook a goldmine of data sitting right in their applications — crash reports and Real User Monitoring (RUM) telemetry. While engineers typically use these tools for performance tracking, they can reveal security incidents that might otherwise go unnoticed. Let’s explore some practical ways to turn your observability data into a powerful security monitoring system.
I’ll help create a table of contents in the requested format based on the headings in the article:
What’s in this article:
- Crash Reporting as a security signal
- Using Real User Monitoring (RUM) for security insights
- Final thoughts
Crash Reporting as a security signal
Content Security Policy (CSP) violations
When your CSP starts blocking scripts and resources, it’s not always just developer mistakes. These violations often point to active XSS attempts or malicious code injections. Keep an eye out for:
- Scripts appearing in places where your codebase never adds them
- External resources loading from domains you don’t recognize or trust
- Suspicious eval() calls or style changes that bypass your security controls
These red flags often reveal weaknesses in your input handling or components that attackers are actively probing.
SQL error patterns
While some SQL errors are just users mistyping queries, patterns in these errors can expose:
- Search inputs stuffed with SQL injection payloads
- Attackers mapping your database structure through carefully crafted errors
- Creative attempts to sneak past your input validation
Reconnaissance detection through 404 errors
A surge in 404s might not just be users hitting dead links. Attackers often leave a trail of 404s when they’re:
- Hunting for hidden admin panels and sensitive files
- Testing known vulnerability paths like /wp-admin or /phpmyadmin
- Running automated scanners that hammer slightly different URLs
Setting up smart 404 monitoring can catch attackers before they find something interesting.
Impossible state detection
Your application enforces rules about what should and shouldn’t happen. When those rules break, something fishy might be going on. Watch for things like:
- Users are getting permission combinations that shouldn’t exist.
- Workflows jumping between states in ways your code doesn’t allow
- Data integrity breaks that your interface shouldn’t permit
- Critical variables holding values that should be impossible
Log these oddities with enough detail to reconstruct what happened.
Authentication monitoring
Authentication logs tell stories about potential attacks. Keep tabs on:
- How many times specific users fail to log in
- Who’s accessing your most sensitive accounts
- First-time logins from new locations
Set up alerts when you see:
- Unusual waves of failed logins
- Login success rates dropping unexpectedly
Check out this article for JavaScript security best practices.
Using Real User Monitoring (RUM) for security insights
Script injection detection
RUM tools can catch unauthorized code running in your users’ browsers. Look for:
- Scripts loading from places they shouldn’t
- Changes in how your JavaScript executes
- Network calls that don’t match your application’s normal behavior
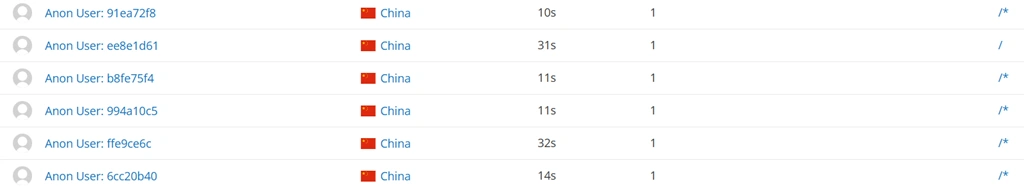
Compromised account activity
When attackers hijack accounts, they leave traces in RUM data:
- Navigation patterns that don’t match normal user behavior
- Rapid-fire access to sensitive features
- Session characteristics that stand out from regular usage
- Large amounts of sessions from the same location (see below)
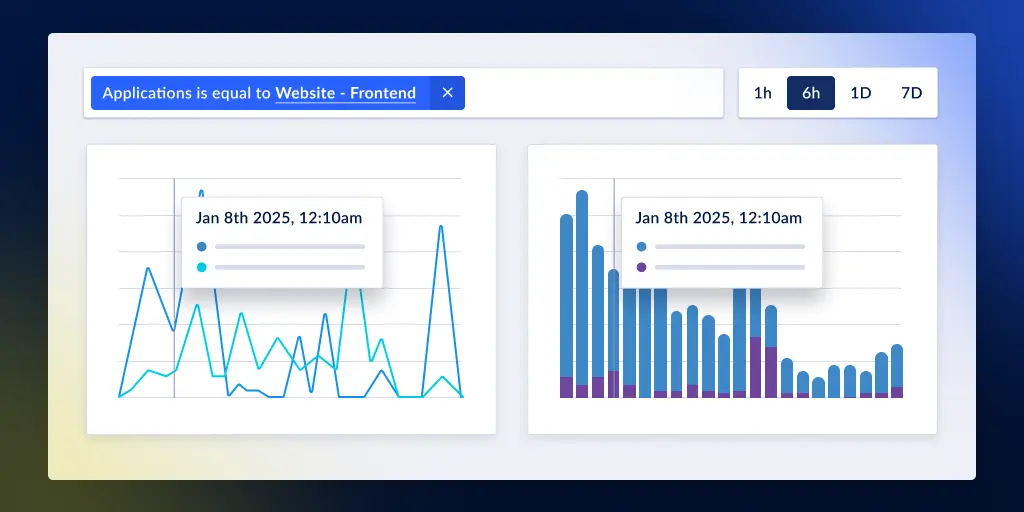
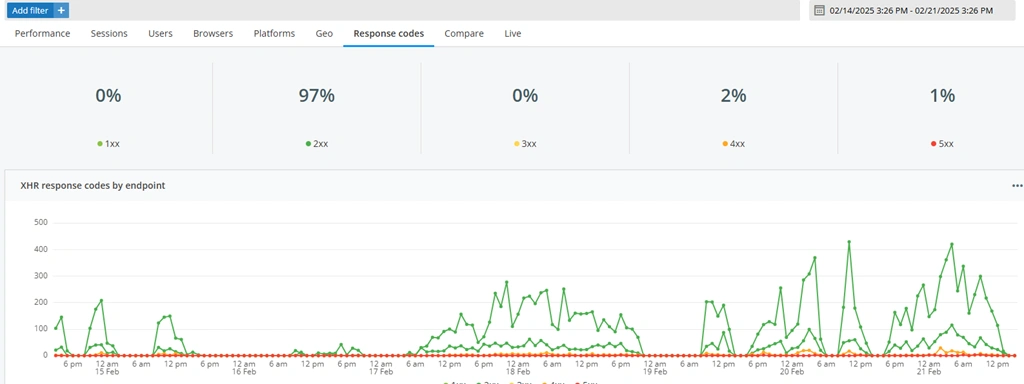
Performance anomalies as attack indicators
Sometimes, performance problems aren’t just bugs but attacks in progress. Watch for:
- Multiple endpoints suddenly slow down together
- Resource usage spiking in unusual ways
- Performance issues clustering in specific locations
- Slowdowns happening alongside other suspicious activity
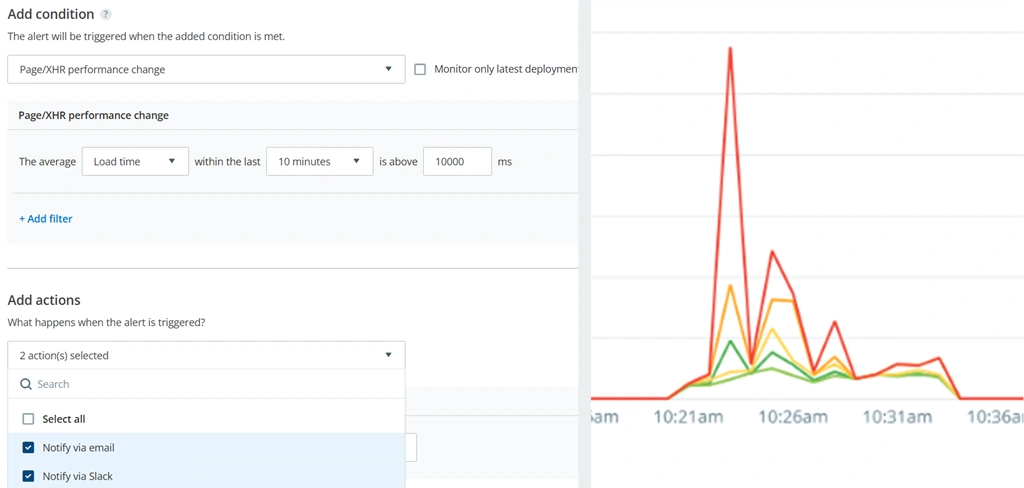
- Check the distrubution of response codes with a filter to detect spikes in 400 and 500 responses (see below).
Set up alerts to help you respond faster to drops in application performance.
Final thoughts
Think of your observability stack as a security camera system installed but not fully used. While engineers rely on it daily for debugging, this same system can catch attackers in the act, often before your traditional security tools sound the alarm.
But like any security measure, observability monitoring has its place. You wouldn’t secure a bank with security cameras - you need vaults, alarms, and guards, too. The same goes for your applications. Build your security strategy in layers, combining observability insights with purpose-built security tools, tight access controls, and active threat hunting. When these components work together, you create a stronger defense against modern threats.
Not a Raygun customer? Try out the full Crash Reporting application free for 14 days!