How I improved Google Chrome & Firefox speed by 31.3%
Posted Oct 11, 2017 | 12 min. (2544 words)Over the past eight months, we’ve been pushing hard, creating as many pages as possible for our public site at Raygun.com. As we added and replaced more and more pages, I became curious about the potential public site performance impact.
As we already had Raygun’s Real User Monitoring (RUM) setup on the website, I figured I should take a look at the performance section to check metrics like page load speed and average load time.
After taking a look at our performance dashboard, I could see that we had room for improvement. Our average load time was 5.21s. I made some improvements and reduced the average load time by up to 31.3%.
In this article, I’ll write about the steps I took to make these improvements, all the benchmarks and the tools I used.
What made me look into our public site performance in the first place?
These were the initial stats that triggered me to look into some performance optimizations:
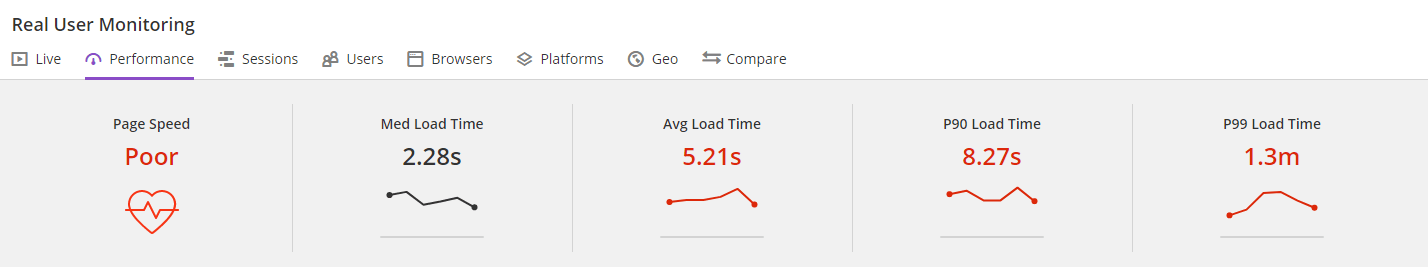
An average load time of 5.21s was a worry, (aim for three or less) so I decided to do something about it.
Measurement
Firstly I needed to decide what I wanted to measure, this would be the basis of my tests and would define the success of our public site performance improvements.
Using Raygun Real User Monitoring, I wanted to measure the following:
- Median load time: The Median response time is what 50% of your customers experience (or faster). This is important because performance makes money – 40% of users will leave a website that takes more than 3 seconds to load!
- Average load time: The site’s average page load time. It is measured by collecting load times at regular intervals across the date range. The load times are then added up and divided by the number of load times collected
- P90 load time: Shows the 90% of your users experience this load time or less, within the date range
- P99 load times: Medians are great, but we also need to appreciate the upper limit. I chose to track the P99 load time which is the time taken for the page to load for the 99th percentile of users. We want to make sure this number is around five seconds slow, not 25 seconds slow
We talk more about what you should be measuring in your software team here.
Ideally, our changes will show improvements in all these numbers however my primary focus is on improving the Median and Average load times.
Using Chrome DevTools I wanted to measure the time taken for the DOM content to load and also the overall Load time of the page. The reason why I choose to measure both these values is for two reasons:
- The DOMContentLoaded event is fired when the initial HTML document has been completely loaded and parsed, without waiting for stylesheets, images, and subframes to finish loading_ (* Thanks to our reader Joacim for offering this suggested explanation.)_
- The Load trigger fires once all the additional logic on the page is complete. An example would be JavaScript’s .onLoad() function or jQuery’s .ready(). The reason why I want to track this value is that it will match up with what Raygun reports back so we will see a correlation between the data
Success
Now that we have some metrics to base our measurements off we now need to define success. To reduce the overall page load time is my biggest goal. But, if I can also get improvements on the DOMContentLoaded time, this would create a better user experience.
Browsers
Knowing what to measure is only the first step, now we need to decide in which environments to test our metrics. Thankfully Raygun’s Real User Monitoring enables us to find out which browsers our users are using. Taking a look at the browser tab on the Raygun application I can see that Chrome, Chrome Mobile, and Firefox are our top three browsers. These became the focus of the tests.
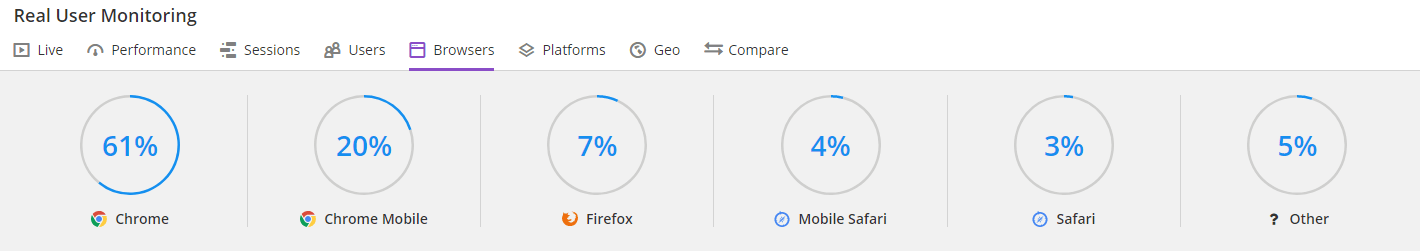
I’ve decided to test the following:
- Chrome
- Chrome with Fast 3G
- Chrome with Slow 3G
- Firefox
- Firefox with Regular 3G
These environments should be enough to measure the improvements in multiple browsers and multiple devices.
Pages
The performance updates that I wanted to make would affect most pages on the website, but I had to decide which pages to measure. I decided to test two pages:
- Our homepage (/) – as this is the first page new users will see when they visit the site. Your homepage should be as fast as possible to ensure a good first impression
- The new Javascript language page (/languages/javascript) – as was a recently created page that needed optimizing
Baseline
Before making any performance improvements, I needed to get some baseline figures to compare my improvements. To make the measurements more reliable I decided to take each measurement multiple times with the cache disabled, then take the median of each metric and use that as the baseline.
My initial tests gave me the following results for my two pages:
Chrome
| Homepage | JS Language page | |||
|---|---|---|---|---|
| DOM content load | Load | DOM content load | Load | |
| 2.97 | 4.32 | 3.36 | 4.52 | |
| 2.37 | 3.71 | 3.39 | 4.77 | |
| 2.35 | 3.24 | 3.65 | 4.54 | |
| 2.7 | 4.04 | 3.26 | 4.6 | |
| 2.48 | 3.82 | 3.28 | 4.19 | |
| Median | 2.574 | 3.826 | 3.388 | 4.524 |
Chrome with Fast 3G
| Homepage | JS Language page | |||
|---|---|---|---|---|
| DOM content load | Load | DOM content load | Load | |
| 6.9 | 9.21 | 8.87 | 12.34 | |
| 6.29 | 9.78 | 8.94 | 11.25 | |
| 6.28 | 8.58 | 8.9 | 12.37 | |
| Median | 6.49 | 9.19 | 8.903333333 | 11.98666667 |
Chrome with Slow 3G
| Homepage | JS Language page | |||
|---|---|---|---|---|
| DOM content load | Load | DOM content load | Load | |
| 23.23 | 36.49 | 31.78 | 41.21 | |
| 22.48 | 31.58 | 31.59 | 43.78 | |
| 21.95 | 34.13 | 32.42 | 40.55 | |
| Median | 22.55333333 | 34.06666667 | 31.93 | 41.84666667 |
Firefox
| Homepage | JS Language page | |||
|---|---|---|---|---|
| DOM content load | Load | DOM content load | Load | |
| 1.16 | 3.78 | 1.85 | 3.55 | |
| 1.72 | 3.7 | 2.5 | 4.37 | |
| 1.91 | 4.02 | 2.36 | 3.75 | |
| Median | 1.596666667 | 3.833333333 | 2.236666667 | 3.89 |
Firefox with Regular 3G
| Homepage | JS Language page | |||
|---|---|---|---|---|
| DOM content load | Load | DOM content load | Load | |
| 2.23 | 8.38 | 3.09 | 13.34 | |
| 2.17 | 8.66 | 3.05 | 13.5 | |
| Median | 2.2 | 8.52 | 3.07 | 13.42 |
Performance Improvements
Now that we have our baseline figures for our tests we can now get started on our performance updates. Using Raygun’s Insights feature, I was able to easily see what needed improvement with additional information on how to fix it.
The first thing I noticed was the that we weren’t properly caching static assets on the website. Our public site is built in ASP.NET, so this was just a matter of updating the Web.config file so that it includes the <clientCache> element inside the <staticContent> element. I could then assign how long I wanted the assets to be cached for, along with what mode you want to use. I added the following snippet to our <staticContent> element to make our static assets stay alive for seven days, for more information you can check out the documentation here.
...
<staticContent>
  <clientCache cacheControlMaxAge="7.00:00:00" cacheControlMode="UseMaxAge" />
</staticContent>
...
To test that the asset caching is working as expected, I opened up the network tab inside Chrome DevTools then loaded up the homepage. I selected an image and took a look at the response headers.
As you can see we have the Cache-Control set to max-age=604800. If you do the math 604800s / 60 / 60 / 24 = 7 days. Great! The calculation seemed to match the values I set in the <clientCache> element, so I could move on to our next improvement.
Adding font files
The next thing I noticed was that all our fonts were loaded in via the google fonts API. Serving these locally will reduce the amount of network traffic and improve page load speed (note: this depends on how fast your server is). As an added benefit if for some reason the fonts.googleapis.com API went down our font files would still get served. Localizing font files can be tedious, but thankfully there are some great open source tools out there to automate some of the processes for us. I used the Google webfonts helper tool, but there are many others out there similar to this, such as this bash script coded by Clemens Lang.
After adding the font files and @font-face styles to the solution and running grunt, I needed to test that my changes worked. I loaded up my local version of the homepage and the current production version of our homepage and did a side by side comparison. I then checked the console to make sure there were no 404 errors.
Localize the run_prettify.js script
My last change was to localize the run_prettify.js script that we use to style our code snippets. Previously, this was loaded in via the rawgit CDN so localizing it was a straightforward process. I visited the CDN URL and saved the file to my computer, added it to the project solution and updated the run_prettify.js references. To test this, I loaded up one of our documentation pages and checked to see if there were any errors in the console and if the styles still worked.
Testing Improvements
Now I made the changes it’s time to test them and see what the results look like and if we have improved our public site performance overall. I took the same amount of measurements for our second test, I then compared the median load times before and after, which would reveal the improvements gained.
Here are the figures I got back from my second round of tests with the cache disabled:
Chrome
| Homepage | Homepage | JS Language page | JS Language page | |
|---|---|---|---|---|
| DOM content load | Load | DOM content load | Load | |
| 2.26 | 3.18 | 3.36 | 4.26 | |
| 2.27 | 3.19 | 3.36 | 4.26 | |
| 2.27 | 3.17 | 3.39 | 4.28 | |
| 2.44 | 3.34 | 3.42 | 4.32 | |
| 2.49 | 3.41 | 3.44 | 4.33 | |
| Median | 2.346 | 3.258 | 3.394 | 4.29 |
Chrome with Fast 3G
| Homepage | Homepage | JS Language page | JS Language page | |
|---|---|---|---|---|
| DOM content load | Load | DOM content load | Load | |
| 6.38 | 8.7 | 9.29 | 11.61 | |
| 6.33 | 8.64 | 9.13 | 11.45 | |
| 6.31 | 8.62 | 9.37 | 11.67 | |
| Median | 6.34 | 8.653333333 | 9.263333333 | 11.57666667 |
Chrome with Slow 3G
| Homepage | Homepage | JS Language page | JS Language page | |
|---|---|---|---|---|
| DOM content load | Load | DOM content load | Load | |
| 23.6 | 31.76 | 32.34 | 41.93 | |
| 23.72 | 31.89 | 32.36 | 41.77 | |
| 23.67 | 31.85 | 32.16 | 41.73 | |
| Median | 23.66333333 | 31.83333333 | 32.28666667 | 41.81 |
Firefox
| Homepage | Homepage | JS Language page | JS Language page | |
|---|---|---|---|---|
| DOM content load | Load | DOM content load | Load | |
| 1 | 2.88 | 1.42 | 2.73 | |
| 1.14 | 3.22 | 1.67 | 3.12 | |
| 1.15 | 3.07 | 1.71 | 2.75 | |
| Median | 1.096666667 | 3.056666667 | 1.6 | 2.866666667 |
Firefox with Regular 3G
| Homepage | JS Language page | |||
|---|---|---|---|---|
| DOM content load | Load | DOM content load | Load | |
| 1.94 | 7.88 | 2.85 | 12.77 | |
| 1.95 | 7.91 | 2.06 | 12.45 | |
| Median | 1.945 | 7.895 | 2.455 | 12.61 |
With this second round of tests, I also wanted to test the speed improvements gained from enabling caching of static content. So, I decided to also get some figures with the cache enabled. Unfortunately, because I didn’t take measurements from before with the cache enabled we aren’t going to see accurate comparisons but at least this will give me a rough idea on the impact adding
Here are the figures I got back from my second round of tests with the cache enabled:
Chrome
| Homepage | JS Language page | |||
|---|---|---|---|---|
| DOM content load | Load | DOM content load | Load | |
| 1.03 | 1.45 | 1.12 | 2.17 | |
| 1.05 | 1.57 | 1.32 | 2.1 | |
| 1.08 | 1.58 | 1.21 | 2.1 | |
| 1.26 | 2.28 | 1.1 | 2 | |
| 1.36 | 1.64 | 1.1 | 1.91 | |
| Median | 1.156 | 1.704 | 1.17 | 2.056 |
Chrome with Fast 3G
| Homepage | JS Language page | |
|---|---|---|
| Load | 1.45 | 1.49 |
| DOM | 2.77 | 3.6 |
Chrome with Slow 3G
| Homepage | JS Language page | |
|---|---|---|
| DOM content load | 2.84 | 2.95 |
| Load | 5.65 | 5.75 |
Comparisons
Now that we have taken our measurements we can now compare both sets of data. I’m looking for exactly how much faster we have made these pages.
Chrome
| Homepage | JS Language page | |||
|---|---|---|---|---|
| DOM content load | Load | DOM content load | Load | |
| Before | 2.574 | 3.826 | 3.388 | 4.524 |
| After | 2.346 | 3.258 | 3.394 | 4.29 |
| Speed Improvement % | 8.86% | 14.85% | -0.18% | 5.17% |
With cache enabled
| Homepage | JS Language page | |||
|---|---|---|---|---|
| DOM content load | Load | DOM content load | Load | |
| Before | 2.574 | 3.826 | 3.388 | 4.524 |
| After | 1.156 | 1.704 | 1.17 | 2.056 |
| Speed Improvement % | 55.09% | 55.46% | 65.47% | 54.55% |
Page speed in Chrome with Fast 3G
| Homepage | JS Language page | |||
|---|---|---|---|---|
| DOM content load | Load | DOM content load | Load | |
| Before | 6.49 | 9.19 | 8.903333333 | 11.98666667 |
| After | 6.34 | 8.653333333 | 9.263333333 | 11.57666667 |
| Speed Improvement % | 2.31% | 5.84% | -4.04% | 3.42% |
With cache enabled
| Homepage | JS Language page | |||
|---|---|---|---|---|
| DOM content load | Load | DOM content load | Load | |
| Before | 6.49 | 9.19 | 8.903333333 | 11.98666667 |
| After | 1.45 | 2.77 | 1.49 | 3.6 |
| Speed Improvement % | 77.66% | 69.86% | 83.26% | 69.97% |
Chrome with Slow 3G
| Homepage | JS Language page | |||
|---|---|---|---|---|
| DOM content load | Load | DOM content load | Load | |
| Before | 22.55333333 | 34.06666667 | 31.93 | 41.84666667 |
| After | 23.66333333 | 31.83333333 | 32.28666667 | 41.81 |
| Speed Improvement % | -4.92% | 6.56% | -1.12% | 0.09% |
With cache enabled
| Homepage | JS Language page | |||
|---|---|---|---|---|
| DOM content load | Load | DOM content load | Load | |
| Before | 6.49 | 9.19 | 8.903333333 | 11.98666667 |
| After | 1.45 | 2.77 | 1.49 | 3.6 |
| Speed Improvement % | 77.66% | 69.86% | 83.26% | 69.97% |
Firefox
| Homepage | JS Language page | |||
|---|---|---|---|---|
| DOM content load | Load | DOM content load | Load | |
| Before | 1.596666667 | 3.833333333 | 2.236666667 | 3.89 |
| After | 1.096666667 | 3.056666667 | 1.6 | 2.866666667 |
| Speed Improvement % | 31.32% | 20.26% | 28.46% | 26.31% |
Firefox with Regular 3G
| Homepage | JS Language page | |||
|---|---|---|---|---|
| DOM content load | Load | DOM content load | Load | |
| Before | 2.2 | 8.52 | 3.07 | 13.42 |
| After | 1.945 | 7.895 | 2.455 | 12.61 |
| Speed Improvement % | 11.59% | 7.34% | 20.03% | 6.04% |
Summary
As you can see from the comparisons above our public site performance has improved from the changes.
These are the ones in green. However, you can also see a handful of stats have worsened. These are the ones in red.
The numbers that increased were likely caused by the localization of assets (fonts and scripts). We can only see it after the effects on the DOM content load. So, basically when the browser is fetching all the required assets and rendering the page.
As for the numbers that decreased, our improvements had a more significant impact on Firefox compared to Chrome. Overall I saw an excellent speed improvement on all pages and devices.
Looking at the comparison of our cached pages, we see some pretty significant improvements. As I said before these won’t be 100% accurate. But seeing an average of 65% decrease in overall page load time is relatively substantial.
The page profiling tool in Chrome DevTools allowed me to break down the improvements and get more granular information. The results show improvements in almost all areas, as shown below:
Homepage
| Before | After |
|---|---|
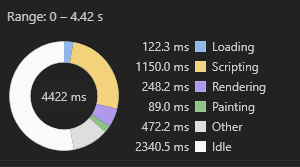 |
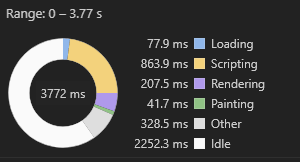 |
JS Language page
| Before | After |
|---|---|
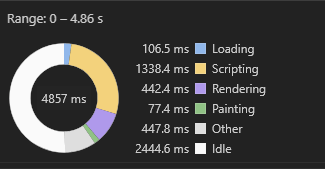 |
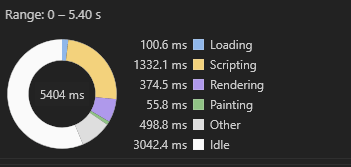 |
Wrap up
Unfortunately, I wasn’t able to measure every page on the website. Therefore, I don’t know if these improvements would be the same site-wide. But, thankfully, I can compare Raygun’s Real User Monitoring performance tab with the snapshot we collected earlier.
Here is what the Real User Monitoring performance dashboard looked like before:
And here is what the public site performance looks like after:
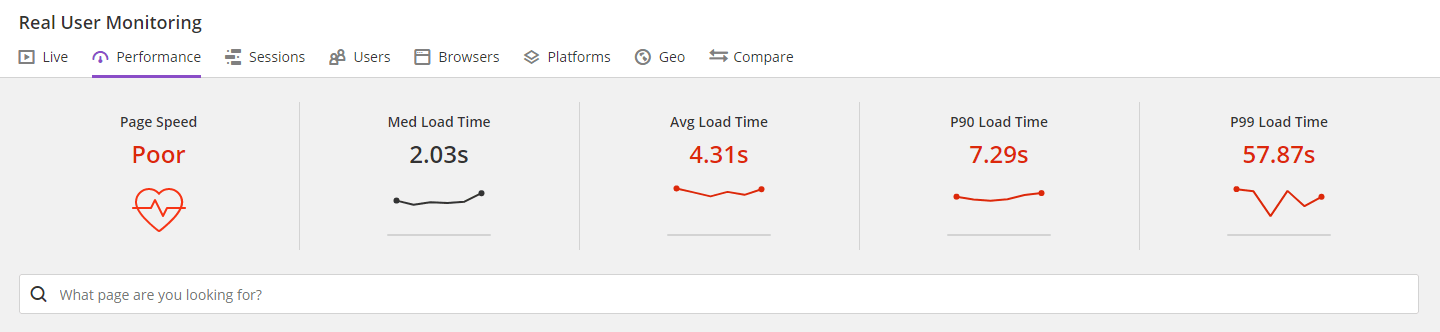
The two performance dashboards show I have speed improvements on all measurements:
- Median load time reduced by 25ms
- Average load time reduced by 90ms
- P90 load time reduced by 98ms
- P99 load time reduced by 20.13s
Overall, I’m happy with the optimizations. However, there is still room for improvement. Next time I plan to ensure image optimization on all pages. I’ll also look at combining scripts, minification on all CSS and JavaScript assets and make optimizations to the script and style order. zow!
Thanks for reading!
Related articles
Saving customers 75 hours per month with Real User Monitoring