Performance testing our NodeJS API
Posted Dec 9, 2014 | 4 min. (715 words)Here at Raygun we’re always looking to see if we can speed things up. We use NodeJS to provide our public API for crash reports – we’ve blogged about that before – and we thought it might be time to see if we can squeeze some more juice out of our API boxes.

I’ve got a couple of tools I like to use for performance testing Node apps. First up, we establish a baseline number of requests that a single API box can serve per second using Apache Bench. That way we can see if any of our changes are actually making a difference. I extracted a test error event from one of our production apps, put that in a file called example.json, and run the following ab command:
ab -c $CONCURRENCY -n 20000 -T "application/json" -H "X-ApiKey: $RAYGUN_APIKEY" -p example.json http://test.endpoint/entries
This will POST the contents of example.js to /entries 20000 times, with a bunch of connections open at a time. I do this from many separate EC2 instances at a time to saturate the box – I tweaked the concurrency number until the API box was at 100% CPU to make sure we were hitting the limit of what it can do.
Once that was all set up, I fired up the app with the --perf-basic-prof flag and followed the rest of the steps in this handy blog post by Brendan Gregg.
sudo bash
node --perf-basic-prof
perf record -F 99 -p 'pgrep -n node' -g -- sleep 30
perf script > stacks.out
stackvis perf flamegraph-d3 < stacks.out > stacks.html
I used stackvis to get the nicer D3.js graph. This gave me a good idea of what functions our app is spending the most time in. Our API is just a way of getting errors into the queue where they can get processed properly – the less we do in it the better, as anyone synchronously calling the API will be held up waiting for us to respond.
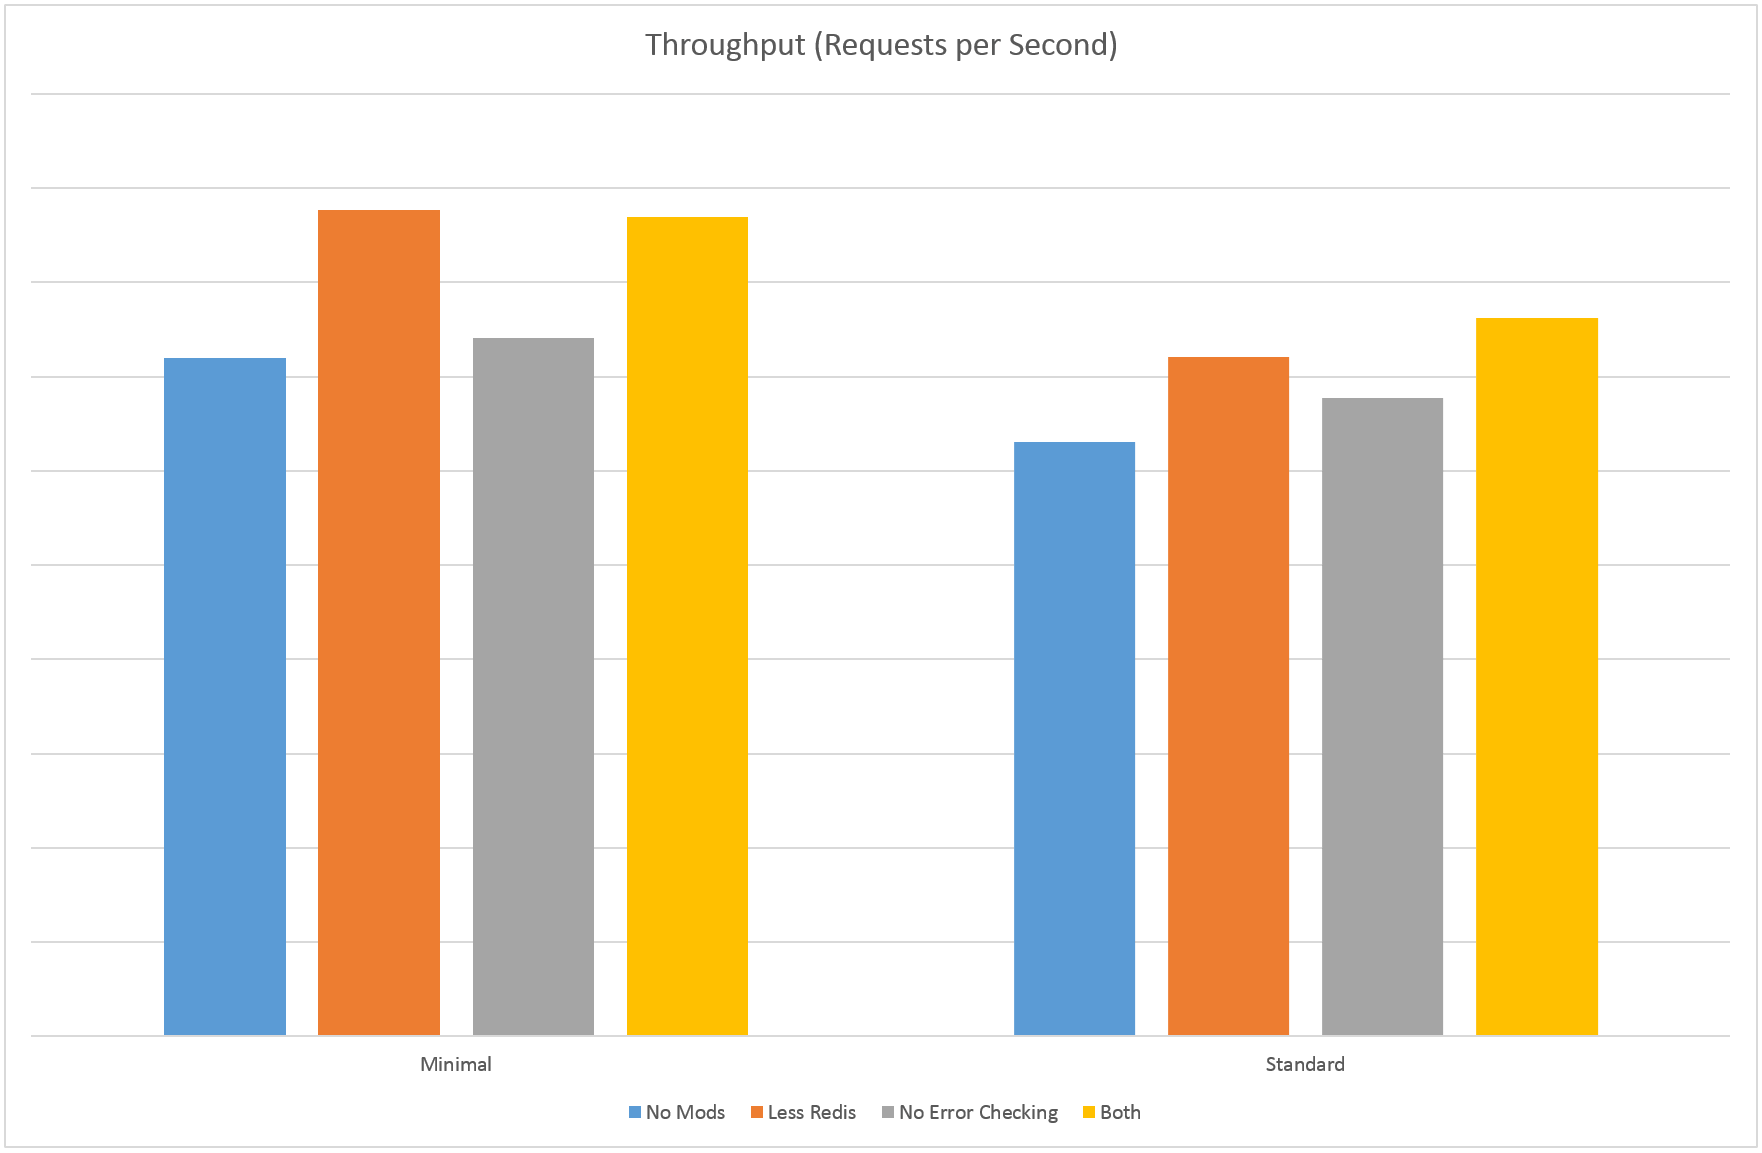
One thing we thought we could delay was error checking – does the API need to sanity check the error data or can that be delayed? Our processing components already have to check this data anyway so maybe we could save ourselves a bit of time by removing this part of the pipeline. The request loading middleware took up about 15% of the flame chart so I thought it might be a good place to start. Unfortunately it turned out to be a bit of a dead end – that code spends most of its time reading the body out of the HTTP request, the error checking took very little time in comparison. Removing it meant we could process an extra 3% requests per second – not much above the margin of error for this test and not really worth it at the expense of having to potentially process junk requests.
The next target was Redis. We’ve got a load balancer in front of our API nodes so we store lookup information in Redis rather than hitting the database every time. The flame graph showed me that 25% of the request time was spent checking information in Redis – another 30% was spent putting the information in the queue. This turned out to be a much more fruitful area to look at, as there were things we were checking in Redis that could be cached locally and looked up less frequently. This approach let us process an extra 13% requests per second, and dropped mean response times by 10%. That’s a bit better!
Something more interesting happened when I combined the two approaches though – we ended up with a 20% increase in throughput above baseline and 16% decrease in mean response time! My theory here is that the request time was more CPU bound once we removed some of the network calls, so removing more of the actual work made more of a difference.
I hope you got something useful out of this post. If you’re a software developer looking for a better way to manage errors in your apps, feel free to sign up for Raygun.
Raygun is an error reporting software system covering all major programming languages and platforms. Check out Raygun’s free trial today and find software errors before your users do.