Deep dive on solving website performance Part 1
Posted Nov 16, 2015 | 4 min. (738 words)Okay, so you’ve got Pulse up and running on your applications, that’s awesome! Now you’re getting some sweet real-time performance data and real user monitoring, what are you gonna do with all this new insight?
1. Pin-point performance pain points
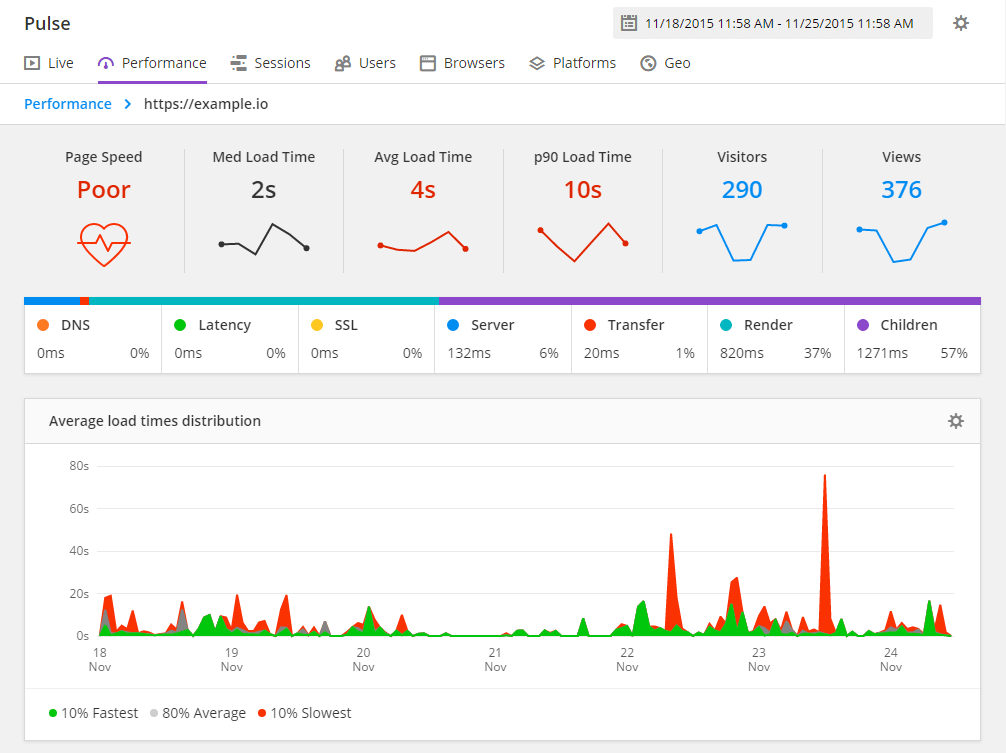
Pulse makes this really super easy. Check out the Performance section and you’ll get a breakdown of the most viewed and slowest pages in your app. I find this is great starting point for identifying and prioritizing which issues to fix. A slow page is generally a key identifier for problems on the server-side and/or the client-side, so let’s have a look at our slowest page with the most views first.
A slow page means a poor user experience, modern users aren’t going to be waiting for longer than a few seconds for a page to load. A user dropping off because of bugs could mean a lost sale or a dissatisfied customer.
Real user monitoring allows developers to quickly identify any unhappy users and cross-platform issues.
For example:
- Your app may have a large proportion of IE9 users who are all hitting a blank page because of a JavaScript error, then giving up to go over to your competitors.
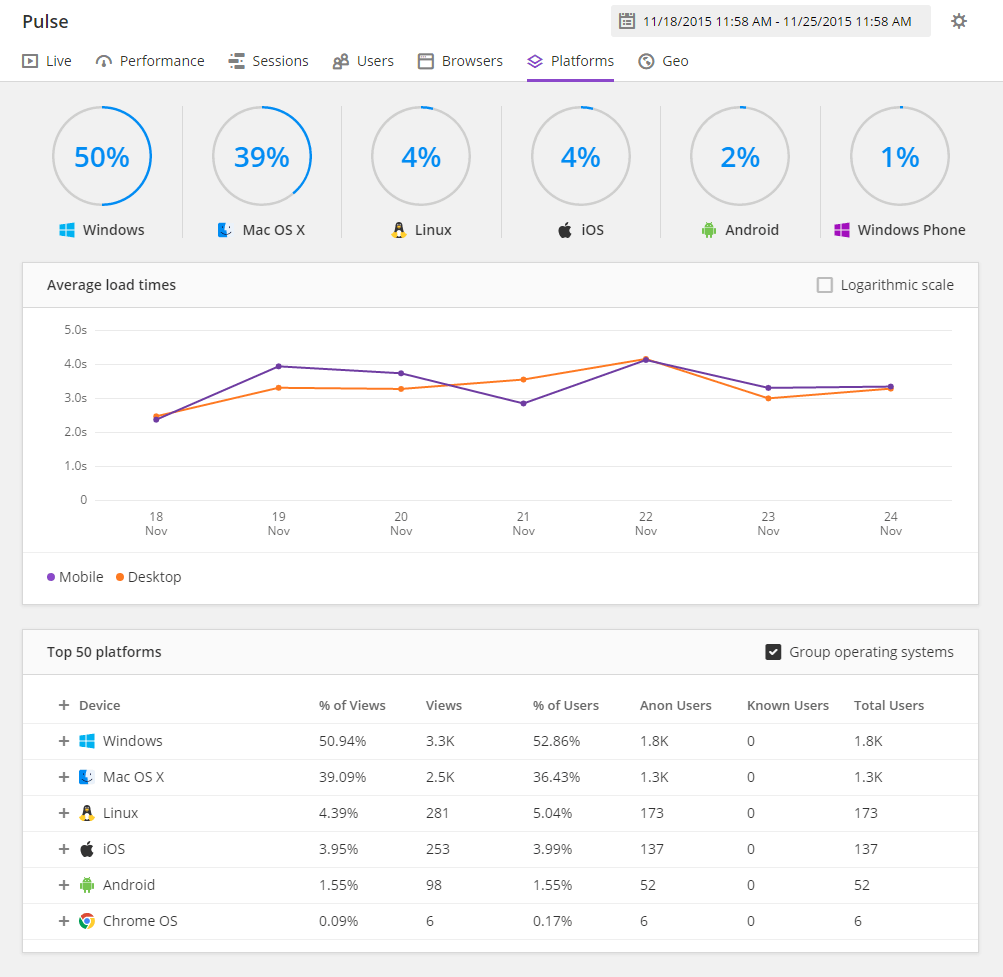
- There are now thousands of different mobile devices. Phones, tablets, phablets all with different screen resolutions and operating systems. Rather than trying to design and build for every single possible, have a look at what your users are accessing your app on with real user analytics in the Platforms section.
2. Page load speed
Pulse breaks down a page’s load time into the following aspects:
- DNS: Time it takes for the nameserver lookup to resolve
- Latency: Time it takes for the host server to receive and process a request for an asset
- SSL: Time to complete an SSL handshake
- Server: Time it takes for the server to compute your code
- Transfer: Time the page has to wait for assets to load from the server
- Render: Time it takes the browser to apply stylesheet rules and compute JavaScript
- Children: Time for asynchronous assets to process
3. I’ve got 99 problems? :O
Don’t be overwhelmed if you’re seeing a lot of issues, we’ll walk you through how to approach problem solving for each of these performance indicators.

“The main web performance speed indicators are latency, server, render” – Jay Z
DNS
A slow nameserver lookup can be caused by a multitude of factors. If DNS is slow, look into changing where your DNS is hosted. If you’re app is used worldwide, we’d recommend a scalable cloud-based DNS service.
Latency
Latency can be alleviated with a few techniques, including:
- Bundling JavaScript using a tool like Browserify
- CDN host front-end assets to reduce round-trip time
- Leverage the browser cache
SSL
On secure pages, the server needs to complete the handshake before anything can happen, so obviously this needs to be as snappy as possible. If SSL is a slow part of the page load on your app, have a look at implementing the following improvements:
- Decrease the number of handshakes made by reusing TCP connections
- Run your SSL processes on a dedicated load-balancer
- Only use SSL on pages which need to be secure
Server
A slow server response is indicative of inefficiencies and bugs in your app. Fortunately there’s a tool to help you quickly identify and zap bugs in your code – Raygun! 😀
Haven’t experienced the magic of Raygun yet? Sign up for a free trial now!
Transfer
Cut down on transfer time by CDN hosting static assets – images, CSS and JS files.
Render
Render time is affected by the following factors:
- Browser resource blocking (too many assets being loaded synchronously before the page can load)
- Large and/or uncompressed CSS and JS assets
- JavaScript errors
- Legacy browser issues
Next step: front-end optimization and enhancements
Children
Asynchronous scripts are an optimization which allow concurrent processes to be performed in a browser. If it looks like these are a slow part of your page load, it’s likely that they are simply sending data to a server (like Raygun and Pulse do).
If you notice that child processes are taking a suspiciously long time, there may be an underlying issue, in which case you’ll want to check out another nifty feature of Pulse: live JavaScript error tracking.
If you aren’t using Pulse for real user monitoring and website performance analytics, you can give it whirl, try Raygun for free for 14 days.