Announcing a date range selector for Raygun Crash Reporting’s error group graph
Posted Jun 14, 2017 | 1 min. (204 words)Raygun has made some UX improvements to the Crash Reporting error group graph by adding a built-in date range selector right in the chart. Now, you can click and select the error graph in order to auto-zoom on a chosen time range.
This is an easy and more efficient way of collecting details on errors occurring within a specific timeframe. Drill down into diagnostic details much faster than with the traditional date picker.
The built-in date range selector has been a highly requested feature – our many thanks to everyone who has sent in this suggestion!
Here’s how the date range selector works
Click and drag a date range that you would like to see more details on in your main Crash Reporting dashboard, it will auto zoom when you release your mouse:
The filter will also apply to your error group list below the graph.
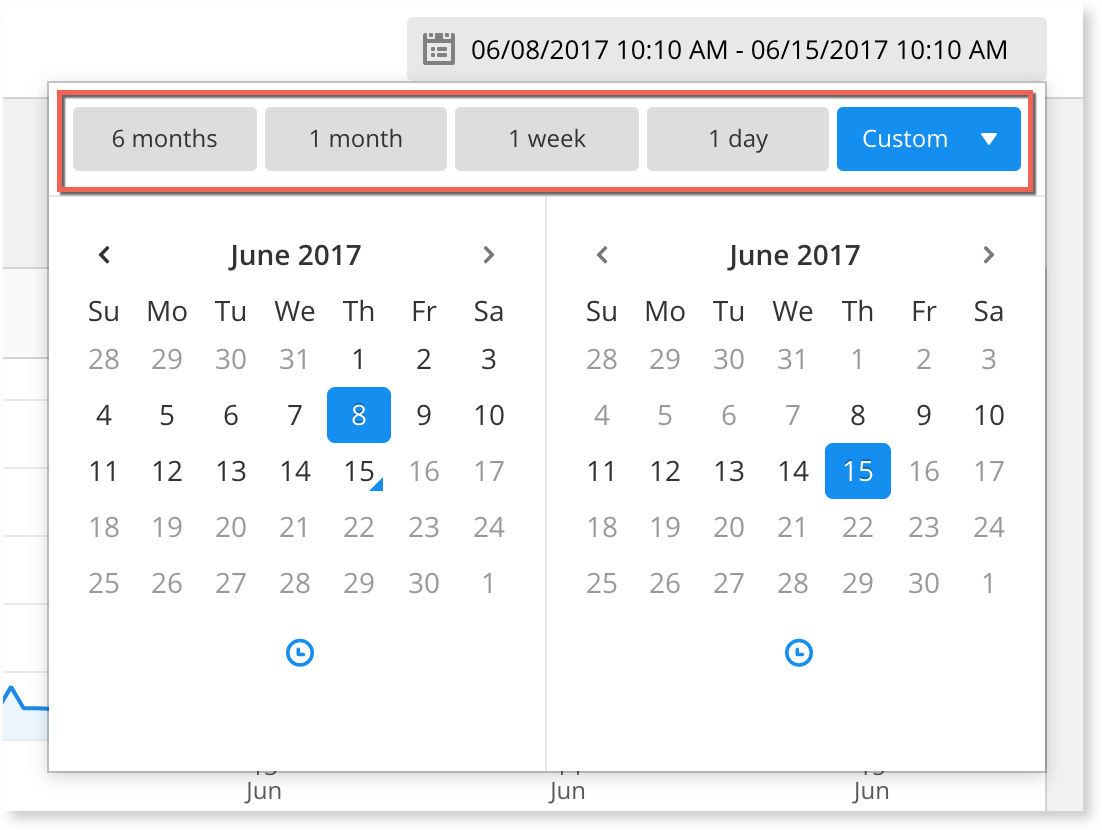
When you’ve finished looking at the details you need, simply head to the date range selector in the top right corner of the error group graph and select your timeframe. This will take you back to your original view:
Do you have any questions about the new date range selector? Get in touch with a team member here.