Why high-performing teams consolidate monitoring tools with Raygun APM
Posted Jun 2, 2020 | 6 min. (1130 words)Raygun helps thousands of software teams diagnose and resolve performance problems faster and more efficiently. We understand that in today’s current climate, there is even more pressure on teams to ensure software quality across the whole stack, all while being cost-effective.
It’s no easy task! But we know that consolidating tools can help. Resolving performance problems becomes faster and more cost effective when your whole team has access to performance data without needing to correlate between disparate tools.
If you consolidate monitoring tools the right way, you can unlock the full power of your application monitoring stack and save money while you do it. Read on to learn more about how Raygun’s performance monitoring suite helped three high-performing teams:
- Consolidate monitoring into a single pane of glass from client to server-side
- Pinpoint performance issues throughout the whole application stack faster
- Understand, measure, and improve user experience
- Get more cost-effective monitoring with Raygun’s usage-based pricing
Consolidate your monitoring into a single pane of glass
When Phillip Haydon, Application Architect at Peach, consolidated tools to Raygun, his team gained a more effective monitoring workflow and saved costs.
Phillip may have a similar story to you. He realized that his current error logging process was holding the team back, especially when it came to prioritizing development time. Enter Crash Reporting, which gave his team the ability to surface errors, and provide enough detail to prioritize, reproduce, and fix problems faster.
But what about server-side issues? Phillip and his team already had an APM tool but wondered if they could improve their workflow by consolidating their monitoring to Raygun. His hunch was right, Raygun APM helped his team diagnose slow traces faster thanks to better quality data and the multithreaded trace support for Peach’s .NET and Microsoft ecosystem.
A few months later, Peach’s Board of Directors wanted to measure the health of their applications. With their newly-consolidated monitoring, the team was able to deliver a comprehensive report, providing statistics on error rates and digital customer experience.
Consolidating monitoring tools helped Phillip and the whole team at Peach prioritize performance and gain end-to-end visibility into the user experience.
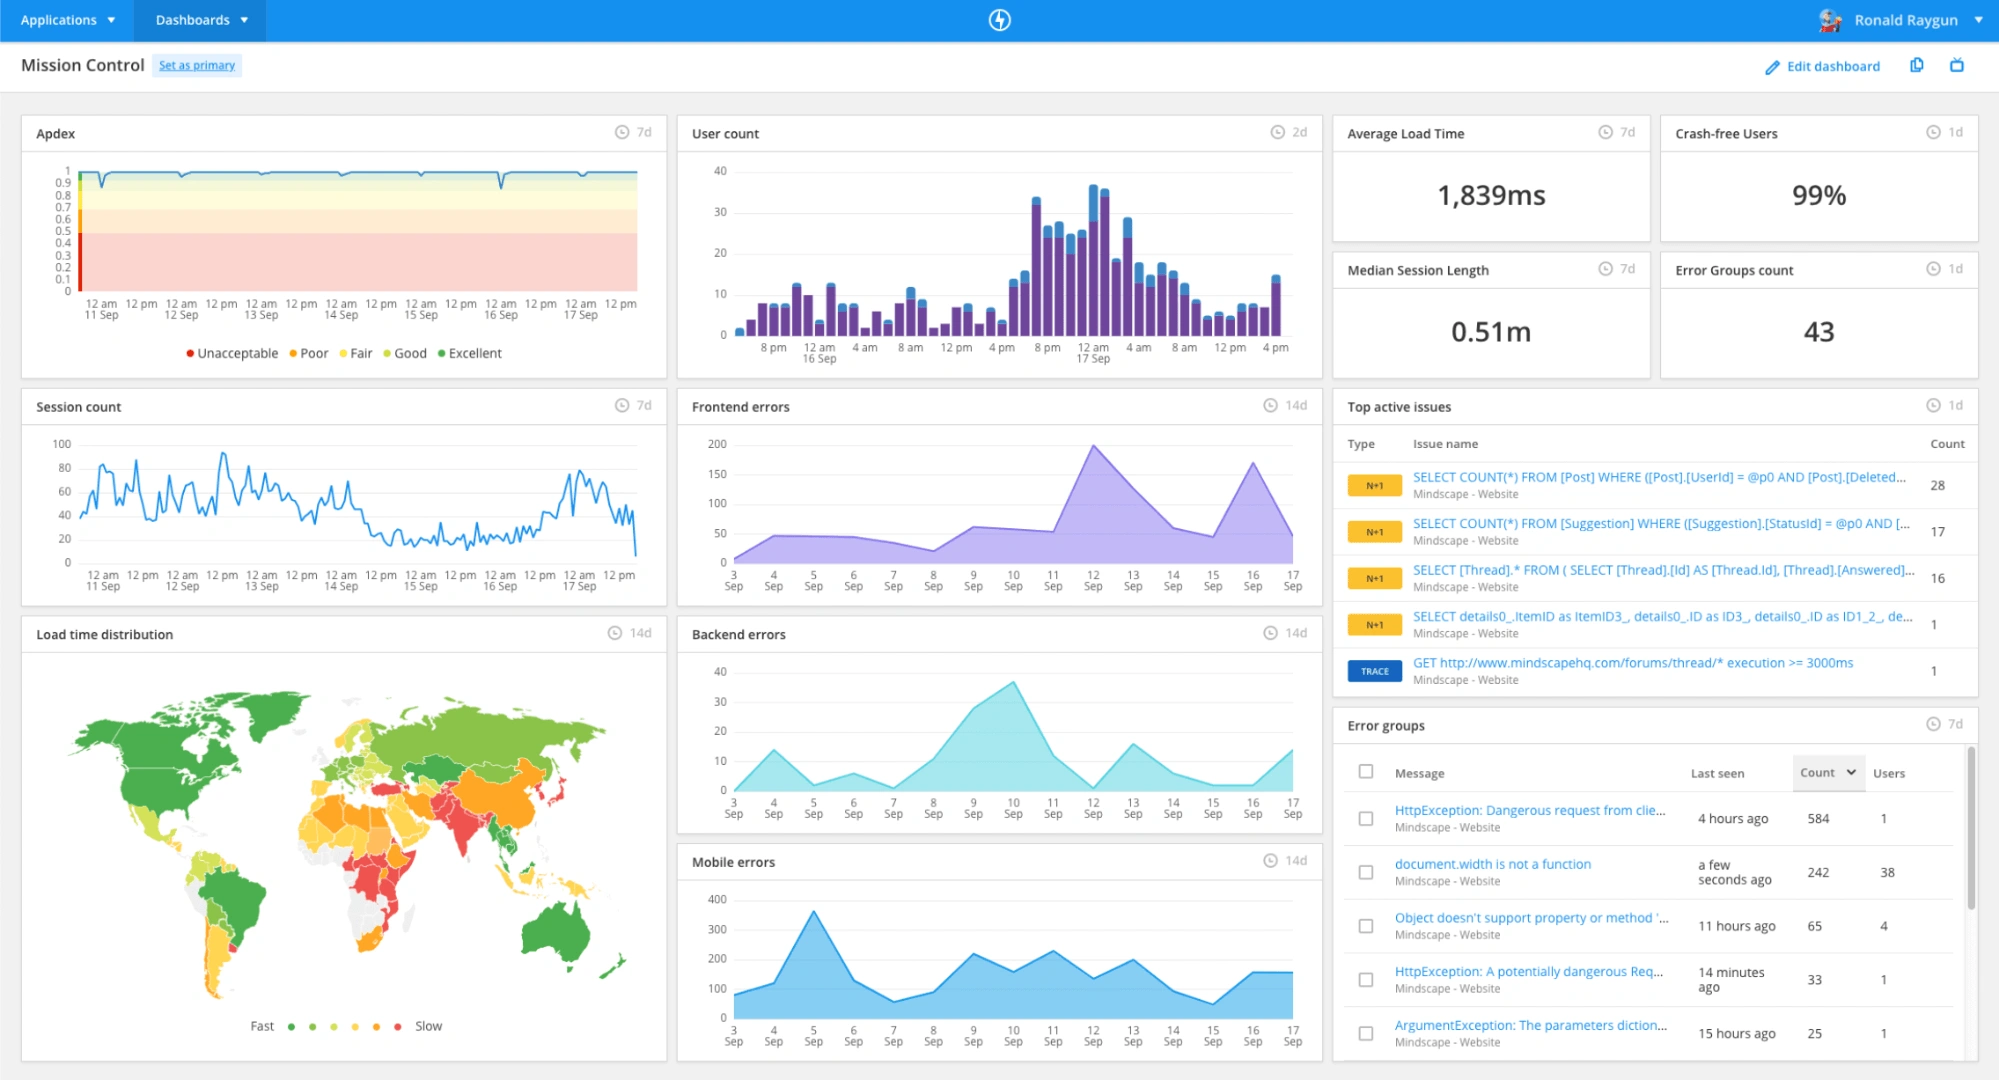
Correlate server-side timings with errors, crashes, and front-end performance with Raygun APM.
Pinpoint performance problems faster
High-performing software teams like Olo, a hospitality software, know firsthand how vital end-to-end visibility is to build a reliable and scalable application. Just one broken payment button or slow-loading page could cause them to lose customers and prevent the company from scaling into an $800 billion restaurant industry.
Olo’s Lead Developer, Greg Shackles, says, “We have bigger and bigger clients in the system and, as a part of that, harder problems. It’s my job to figure out how we build a more scalable system.” Crash Reporting gives the team fully integrated error monitoring in production. But the team needed more visibility into the root cause of server-side problems. He found Raygun APM a good match for their .NET environment, in particular the support for multithreaded traces.
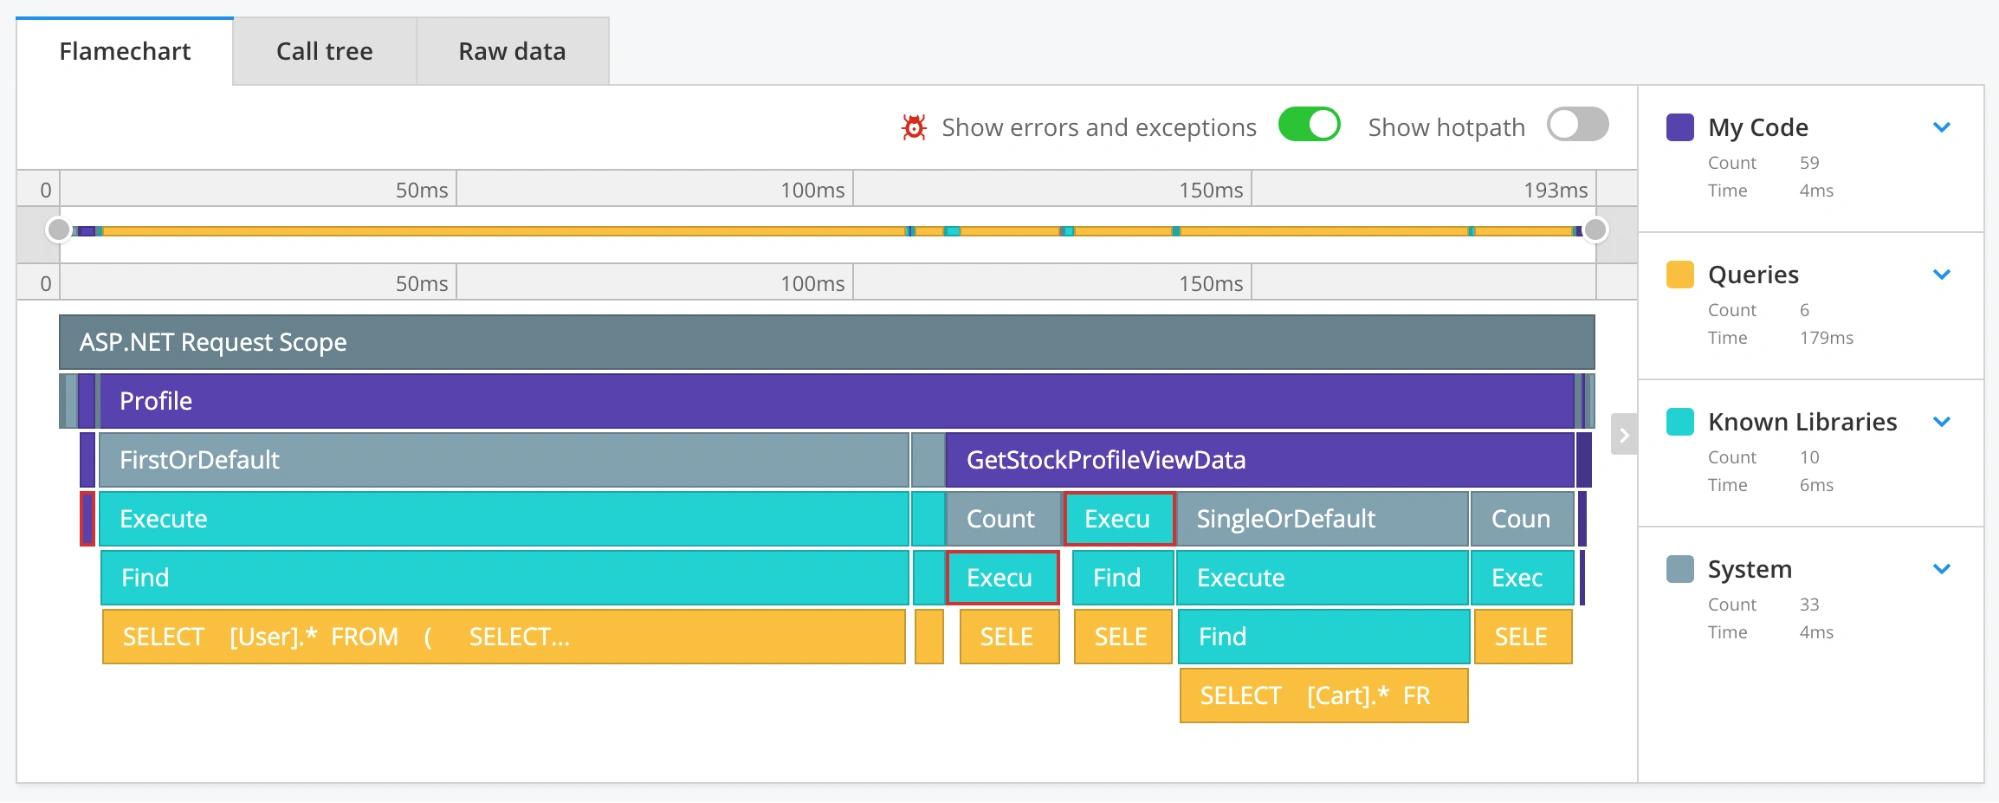 The multithreaded trace support in Raygun APM helps the team at Olo get visibility into server-side problems
In one example, he recalls the flame charts of server-side performance timings highlighted lingering issues in production. Greg explains, “After installing Raygun, we attempted to reproduce a recent production issue that took a while to track down. A brief look at the flame charts pointed to the problem in a fraction of the time it had taken us before.”
Greg made the easy decision to consolidate Olo’s application monitoring stack to Raygun. They are now able to provide end users with an exceptional level of service, all with more actionable diagnostic details and end-to-end visibility through that single pane of glass.
Gain user-level detail with Real User Monitoring
A cornerstone of performance monitoring is that it is able to identify when a user has taken actions that have resulted in an unhandled exception.
Using Raygun APM and Real User Monitoring can go a step further, and answers the question, who did this problem affect? Teams can:
- Easily investigate and diagnose performance problems
- Prioritize performance optimizations affecting real users
- Measure trends in front-end performance
Raygun Real User Monitoring helps teams drill down into slow load times
Fast-loading pages and an easy-to-use UI are non-negotiables for Vetserve’s customers, who are busy veterinary professionals relying on the software for the day-to-day running of their practices. The responsibility to provide a seamless software experience falls to Chief Development Officer, Vidar Sømme, and his development team — a task they take seriously.
“With RUM, we don’t just get an ID or generalized data about users and the crashes they’ve experienced,” Vidar explains. “Raygun makes crashes tangible by connecting them back to an affected user and their details. We can say: ‘John, at this clinic, experienced this particular crash at this particular time.’"
RUM can also show when a slow load time is the result of slow server side response — which you can use Raygun APM to investigate with a single click.
Real User Monitoring makes connecting your code to real customer impact easy.
Making the most of your budget
Consolidating your monitoring tools allows you to make the best use of your budget. Raygun APM works seamlessly with Crash Reporting and Real User Monitoring to provide a holistic view of how software quality affects real people and their experiences. There’s no need to piece together multiple tools anymore, which can have significant cost-saving benefits.
We designed Raygun APM to be accessible to modern software teams, regardless of infrastructure. That’s why we recently launched usage-based pricing. Here’s how Raygun Real User Monitoring stacks up against New Relic, for example.
| New Relic | Raygun Real User Monitoring | |
|---|---|---|
| 100k Sessions | $357.60 | $120 |
| 500k sessions | $1,788 | $600 |
| 1m sessions | $3,576 | $1200 |
Monthly pricing (assuming 8 page views on average per session for New Relic pricing)
It’s time to empower your team with all the diagnostic details they need to deliver better customer experiences. Make decisions faster, save time moving between tools, and get unrivaled diagnostics into the health of your software.
Ready to consolidate your application monitoring?
If you’re looking to move from an existing provider
You can make the switch and receive $20k in free usage credits. You can apply here.
If you are on a single product plan
If you’re already a Raygun customer, it’s easy to add additional products to your plan. Just get in touch and we’ll be happy to help.
New to Raygun
Start a free trial of all of Raygun’s products and get data flowing in minutes.
Note: Raygun APM is currently available for Ruby application monitoring, .NET, .NET for Azure App Service, and .NET Core. Watch this space for Node.js, coming soon. To register your interest in future language support for Raygun APM, please add your details to this form.