Atom powered Raygun – a Raygun plugin for Atom!
Posted Mar 12, 2014 | 2 min. (358 words)Recently GitHub released a new text editor named Atom. Atom is a desktop application based on web technologies.
Since Raygun already integrates with GitHub, we thought we would give Atom a spin and write a plugin that would allow you to view your errors within Atom and zoom directly to the file where the error occurred. We have this ready for you to test right now so you can add it to your Atom installation and get blasting those errors!
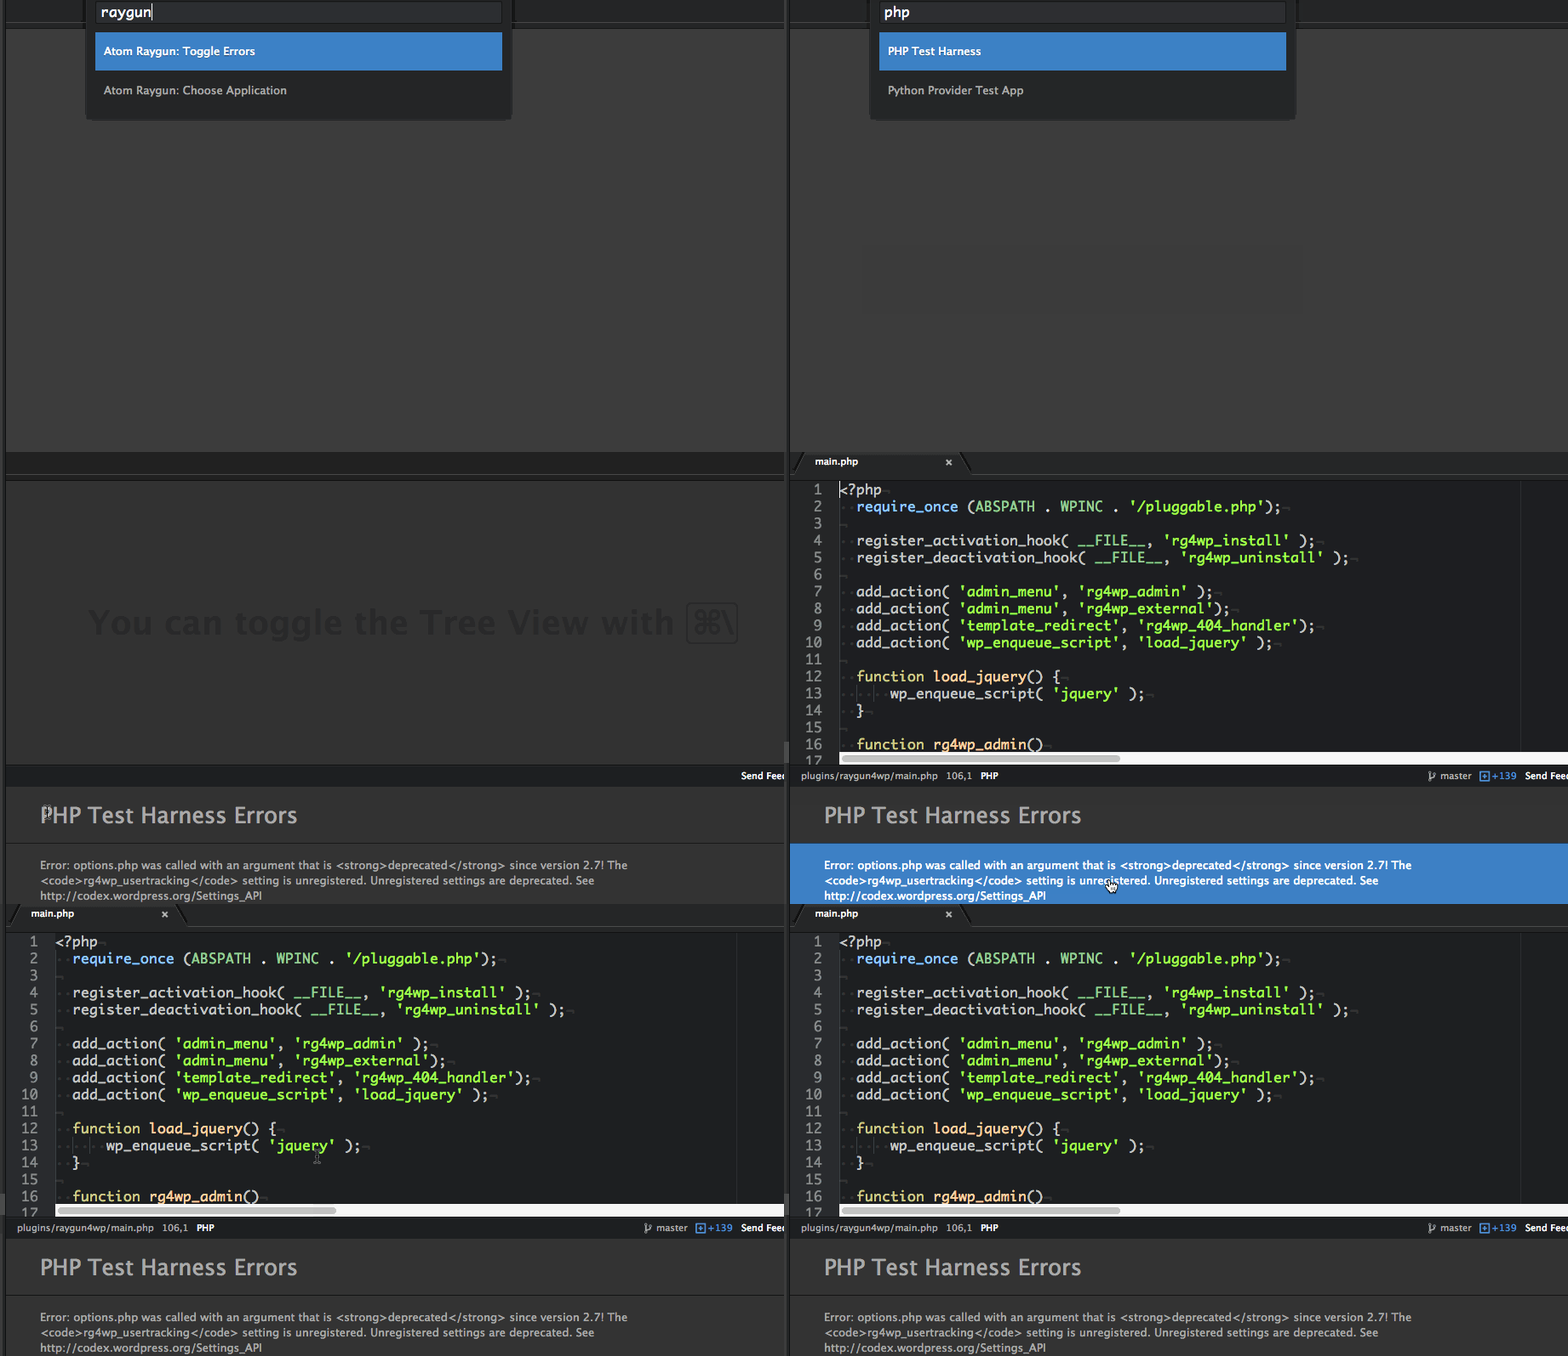
The Atom plugin in action
Current features of the plugin today are the ability to view your list of applications and pick one. This will bring up a pane that will display your 20 most recent active errors. You can click on these errors and the plugin will attempt to find the file in your project that best matches the first line in the stack trace of the error.
You can view the plugin on GitHub and we welcome any extra features you may want to be submitted!
In this Web 1.0 “video”, you can see we start the Raygun Atom plugin, select the application that we want the errors for, and then get a pane showing the live production errors for the software. Double clicking on the error group takes you to the file with the issue. Magic!
We’re still working towards getting full lists of errors, and jumping to the affected line (it’s in there, but Atom doesn’t handle it quite yet, it is beta software at the moment).
Why this is cool
We think Atom has a great future ahead. It can support many different languages, just like Raygun. We absolutely think that having your production errors visible within your development tool of choice is useful. The easier Raygun can make it to have robust software, the better for everyone 🙂
Create your account
If you have Atom and want to try this out, start a 14 day trial of Raygun – no credit card required. You can sign up in a matter of seconds. It couldn’t be easier to be improving your software quality.


