Announcing refreshed Error Group List UI
Posted Feb 19, 2016 | 4 min. (710 words)_Update: This post was last updated January 2017 to include the ‘Resolved by user’ filter. _
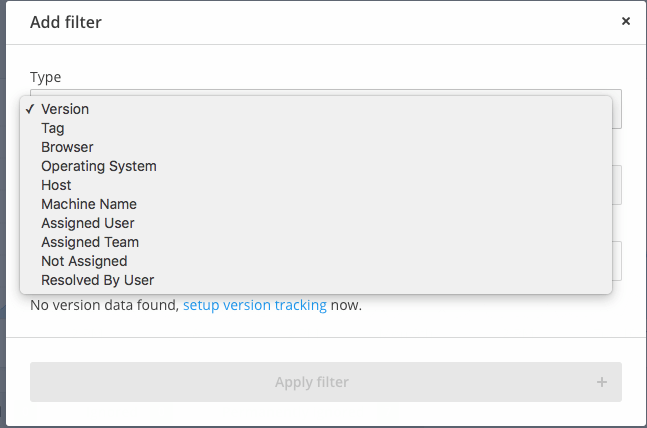
As of January 2017, Raygun has added the latest filter to our error group list**.** This new filter is labeled ‘Resolved By User’ and is shown in the ‘Add filter’ dropdown in the ‘Error Group’ window. Using this new filter, you can now filter errors by which user resolved them. If an error is still open, or has been resolved and then reopened it will not be included in the results of the filter. You can use this new filter to see which of your team members are resolving the most errors (and which errors they resolved).
The ‘Not Assigned’ filter allows you to only see the errors in your error inbox that have not yet been assigned to your software development team for attention. Usually, you would want to ensure that there are no errors that are left unassigned for a fix. If your error inbox is looking quite full, you may want to use this filter to help isolate errors that are still occurring in your software.
If you’re an existing Raygun customer with Crash Reporting and you’ve visited the Error Group List (https://app.raygun.com/crashreporting/{yourAppId}) recently, you might have noticed a few interface changes! Here’s what it looked like before:
Previous interface

And here’s the redesign, complete with new precise time picking functionality:
Refreshed interface

The Error Group List view is the heart of Crash Reporting, as it provides an interface to view, filter, search and assign errors for your application, and allow you to view particular groups to see the stack traces for its error instances. One of the key aspects in hunting down errors is to drill down to a particular time range where you suspect a desired error may have occurred. Previously this was done using the chart’s time scrubber (or ‘brush’) on the mini chart below the main one. This was in place since shortly after the MVP, and we’ve had a lot of feedback since then about how it could be improved.
In particular, discoverability was an issue when new to Crash Reporting, as many found it wasn’t immediately obvious that the mini chart was clickable. Also, after receiving a few month’s worth of data, it became increasingly hard to select fine-grained time ranges using the brush’s handles with the mouse. This feedback, along with the implementation of the improved dropdown-based time picker in Pulse, has lead to us porting that time picker over to Crash Reporting.
Using the new time picker
As such, you can now select time ranges by clicking on the top-right dropdown (see below), which gives you the option to pick one of four common ranges, or a custom range with your desired level of precision. The selected time range is now no longer displayed alongside the blue filter widgets, but instead the text updates to reflect the current time range in effect. ‘One week’ is the default, therefore selecting this clears the query string and resets the view. This functionality was previously only available for Crash Reporting in the Search view, but is now available in the main view.

The blue filter widgets have also been moved above the chart to reflect that these are being applied to both the chart and the error group list itself. We’ve also had some great feedback about improving the UX of the filtering, and there’s some great ideas in the pipeline to make it fast and intuitive to filter by tags, custom data, browsers, operating systems etc.
In general, we hope you find these changes useful and help your workflow. These changes aren’t made lightly and we aim to keep functionality consistent with no breaking changes, but sometimes improvements needs to be made as it will result in much more pleasing experience. We aim to maintain both Crash Reporting and Pulse to a high standard and apply upgrades from one to the other as we discover improved usability approaches.
If we’re missing a particular feature or there’s a usability concern for either product you’d like to see resolved, let us know in the Feature Requests forum or in the comments below.
Thanks for reading, we hope Raygun continues to be useful for you and your team!