Monitoring .NET Core - Raygun’s multithreaded trace capability explained
Posted Oct 25, 2019 | 5 min. (892 words)Raygun’s CTO Jeremy Norman chats with Alex Williams of The New Stack to give a technical demo of the multithreaded trace feature in Raygun APM. Jeremy offers practical examples of how traces work, how you can monitor microservices more accurately, and why Raygun is different from other APM tools.
Here are the highlights - plus watch the full demo below.
Originally published on The New Stack.
What makes Raygun different from other tools when it comes to .NET Core support?
Jeremy explained that one of the key things about .NET Core is that it was built from the ground up with performance at the forefront, which means everything you do within the .NET Core framework is executing asynchronously.
This, in turn, creates many threads, which can make monitoring complex - especially when monitoring multiple applications. To capture, profile, and see what your requests look like, you need to be able to fully capture the multiple threads and asynchronous work that is being executed.
With our latest APM support for .NET Core, we’ve been able to provide this actionable data using our multithreaded trace capability.
Whether you are using the TPO library, tasks, or even just Async/Await syntax, you will be able to understand any performance issues quickly, with unrivaled actionable details.

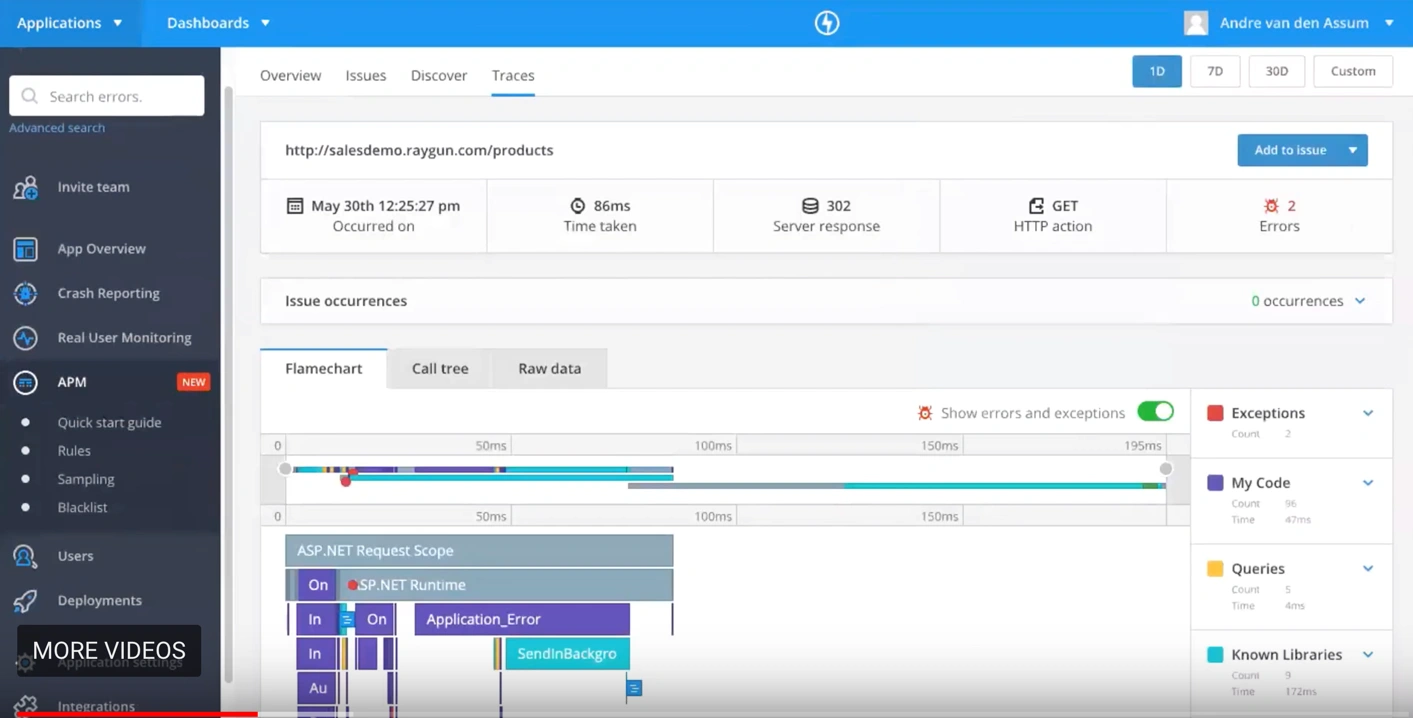
In the example above, you can see that there is more than a single thread being captured. There are multiple threads marked as they are being executed in the code shown in the easy to read flame chart. You can drill down further using a source repository integration (like GitHub), which pulls in the lines of code that caused a problem.
Link with Crash Reporting
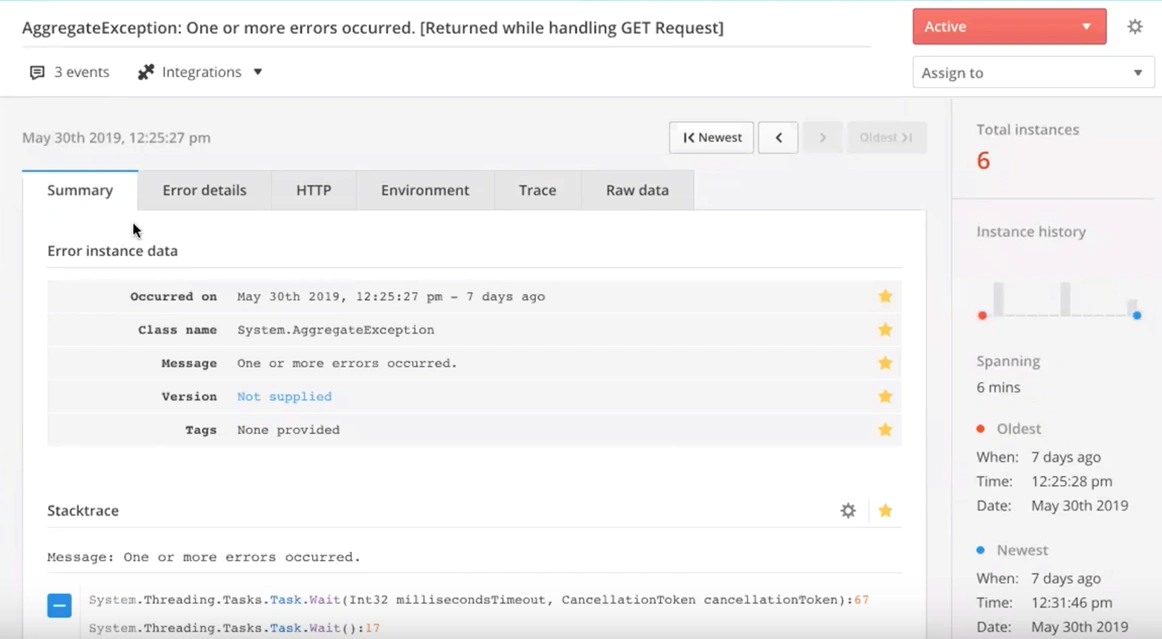
If you have Crash Reporting enabled, as your code is being executed, you may see a red dot on one of the threads. This is an alert to let you know an error has occurred. Click on the error to see details like the stack trace, environment, and more, allowing you to diagnose the error faster. No more jumping between tools trying to match timestamps to error reports - it’s all available in one tool.

Compare code performance
When you’re writing code that is multithreaded, it can be hard to know if the code you are writing is more performant than what you have written previously. You may be writing code in parallel, but a lot of the time, there’s overhead and complications.
For example, the output of one thread will be dependent on the input for another thread, so you end up blocking your code waiting for the other to execute. Using Raygun’s flame chart, you can see whether there is more overhead in creating a new thread versus keeping work in a single thread.
An easy to understand UI
With so much information to display, we put a lot of thought into how developers would use this every day.
The overview bar at the top is split into the types of code that have been executed for quick reference so you can see how many threads were in play, what kind of code was being executed, and how much time has been spent on your code versus other frameworks.

Raygun can also shrink tasks together, so you can visualize your code and what would be a single stream rather than a call tree view.
Monitoring microservices is easier with Raygun APM
As soon as you plug in Raygun, you’ll have something to action. There are plenty of products that just surface data, but don’t show you what to do with that information - leading to data overwhelm.
Developing microservices is difficult for this reason - as we make more microservice calls, we want to make sure we are optimizing as we go. If we don’t, we end up with an API plus one issue where you make many calls that may be introducing a performance bottleneck, or a slow down in your application.
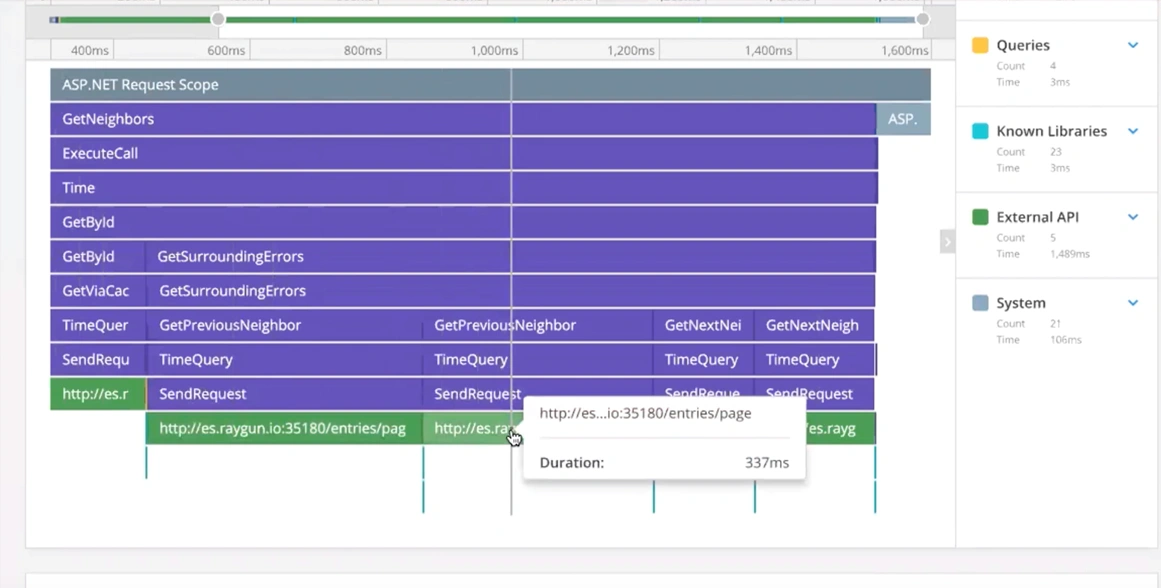
Because of the multithreading capability, Raygun can show you why an issue occurs so you can drill into the specific instances of where the issue has been detected.

In the example above, each green block, representing an API call, is a thread that is being executed in sequence. This is something that we need to optimize as they could be running in parallel, causing performance overhead.
Jeremy explained that “Without multithreading support, we still would have captured that primary thread, but you would have been missing that second thread that was executing. This also gives us an insight into the advanced nature of the .NET framework.”
In the video demo example at 12:19 in the video, Jeremy triggered two tasks that have been executed into a primary and secondary thread. Where we might have expected both tasks to be spawned onto new threads, the framework has decided to run one task on the thread while we’re waiting for the second to execute. As Jeremy explained, the .NET framework optimizes things under the hood all the time.
Therefore, if you’re not profiling your code and tracing it, you won’t have the visibility into how many threads it’s creating under the hood.
Because Raygun APM supports multithreading, developers are able to see the trace breakdown and get valuable insight into how the framework’s operating.
What’s next for Raygun APM?
Raygun is continuing to develop APM language support, including Ruby, Java, Node, and PHP.
![Speed AND Reliability: How to move fast and fix things [Webinar] featured image.](/blog/images/github-webinar/feature.png)
![Solving complex performance problems in .NET Core [Webinar] featured image.](/blog/images/performance-webinar/feature.png)
