Java debugging tools you should know
Posted Aug 15, 2023 | 7 min. (1351 words)In an ideal world, bugs would never reach production. But software errors are an inevitable part of a developer’s life. Java debugging tools exist to help us resolve errors faster, so we can get on with doing what we do best.
This list of Java debugging tools will help you evaluate your options quickly so you can find the best for the job.
1. Raygun Crash Reporting
One of the hardest things about debugging is that you don’t always know which errors your users are experiencing. Raygun Error Monitoring has everything you need to discover bugs, errors, and crashes that happen in production and beyond.
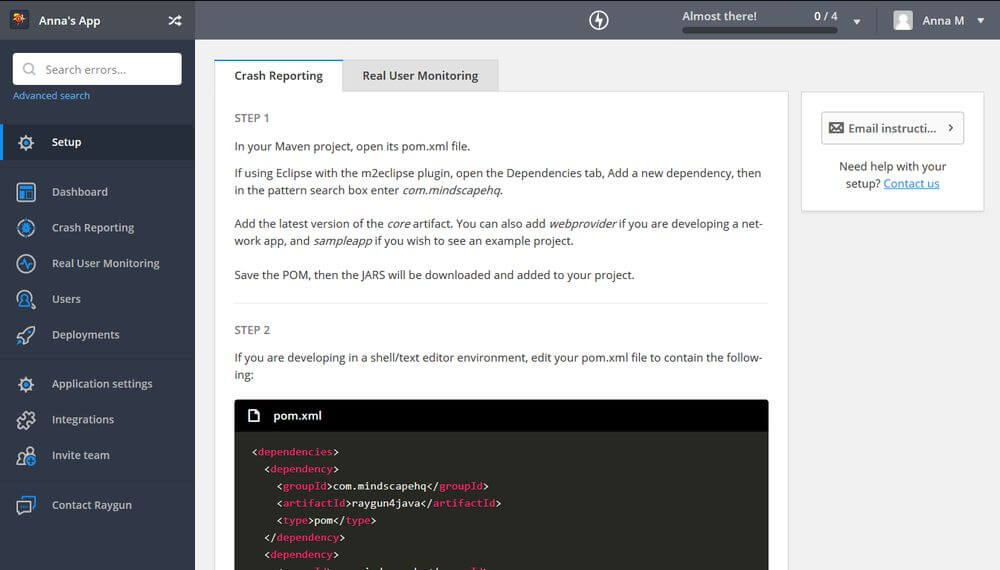
Raygun4Java allows you to send exceptions from desktop and console Java and Scala apps by default. You can send all your exceptions to your Raygun dashboard so that you can see a detailed diagnosis for each error, including full stack traces, data related to method, function and class names, and more.
The installation and configuration doesn’t take more than a few minutes. Raygun can process any object that inherits from the Throwable class. Advanced features like Breadcrumbs, Filters, and Custom Tags make the debugging process easier, too.
2. Eclipse

Eclipse is a popular open-source IDE that’s used for Java development, but it also has plugins for other languages like PHP, Python, Ruby, and C#. The Eclipse platform comes with advanced debugging features that help you inspect your code during execution, making it a well-rounded tool. A big advantage is that the Eclipse workflow is convenient because you can use the same platform for both development and debugging.
One of the best features of Eclipse is the Debug Perspective, which shows relevant debugging information side-by-side, such as variables, breakpoints, threads, and call stacks.
With Eclipse, you can also suspend and resume threads, step through the execution of the program, inspect values, and evaluate expressions.
3. NetBeans
NetBeans is another free and open-source IDE. Like Eclipse, the debugging functionalities are built into the platform, so you only need to download the IDE to get the debugging tool.
NetBeans comes in different download bundles; for Java, you will need either the Java SE or the Java EE edition. The latter also has support for HTML5, JavaScript, and the GlassFish and Tomcat servers, so it’s a better choice for more serious development work.
The NetBeans Debugger has many similar features to Eclipse. In fact, both are excellent debugging tools to inspect the source code and identify issues such as memory leaks and concurrency problems. NetBeans allows you to set up breakpoints and conditional breakpoints, step through the code, switch threads, and monitor execution in real-time.
NetBeans also provides you with the handy Visual Debugger feature so you can debug the visual elements of your Java and JavaFX GUI applications. With the Visual Debugger, you can add listeners to GUI actions, view component properties and the hierarchy of components, and locate the source code.
If you use NetBeans, you also get access to the built-in NetBeans Profiler tool. With the profiler, you can check memory usage, CPU performance, thread states, and other characteristics of your Java application. These features work together to help you optimize speed and memory usage and reduce overhead.
As NetBeans was acquired by the Apache Software Foundation in early 2018, you can expect more integrations and extended features in the future — especially as Apache already hosts many of Java projects from the Maven build tool to the Tomcat server.
4. IntelliJ IDEA

Besides Eclipse and NetBeans, IntelliJ IDEA is the third IDE Java developers usually mention when you ask them which IDE they use. Developed by JetBrains, IntelliJ IDEA comes with both an open-source community and a paid commercial edition. It’s mainly a Java IDE, but you can also use it with other JVM languages such as Groovy, Kotlin, and Scala. The commercial edition supports many JVM and non-JVM frameworks too, such as Spring, Java EE, Play, Grails, GWT, and Vaadin. Better still, both editions come with support for Android development — great if you are running multiple projects. Just like the IDE debuggers mentioned above, IntelliJ IDEA also includes a built-in Java debugger that works out-of-the-box.
IntelliJ IDEA has all the standard debugging features you’d expect from a best-in-class debugging tool. IntelliJ IDEA allows you to:
- Create and configure breakpoints and watchpoints
- Evaluate expressions
- Pause and resume the debugger session
- Examine suspended threads
- Step through the source code
- Analyze memory usage
- … And more
You can also use IntelliJ IDEA to debug Java applications remotely.
Inline debugging is the most interesting and unique feature of IntelliJ IDEA. The inline debugger displays the values of variables within the code, right next to the line where they were used. Whenever the value of the variable changes, the inline debugger highlights it with a different color. To check out the values, there’s no need to move to the Debug window or hover over each variable one-by-one like with With Eclipse and NetBeans.
5. Visual Studio Code
You don’t always need to use an IDE to debug Java applications. Microsoft’s cross-platform source code editor, Visual Studio Code also makes Java debugging possible through the Debugger for Java extension.
If you use Visual Studio Code for code editing anyway and need a lightweight and easy-to-use debugging tool for your Java development workflow, Visual Studio Code is a great choice. Although it doesn’t have as many advanced features as IDE debuggers, it knows everything you need for a quick debugging session.
Visual Studio Code’s Java debugger is based on Java Debug Server which extends another Visual Studio Code extension called Language Support for Java by Red Hat.
VS Code debugger allows you to:
- Perform local and remote debugging
- Set up conditional breakpoints and logpoints
- Step through the source code
- Inspect and watch variables
- View call stacks
- Debug multiple threads
- Evaluate expressions
- Use hot code replacement
VS Code’s debugger extension comes with many configuration options you can check out in the docs.
6. The Java Debugger (jdb)
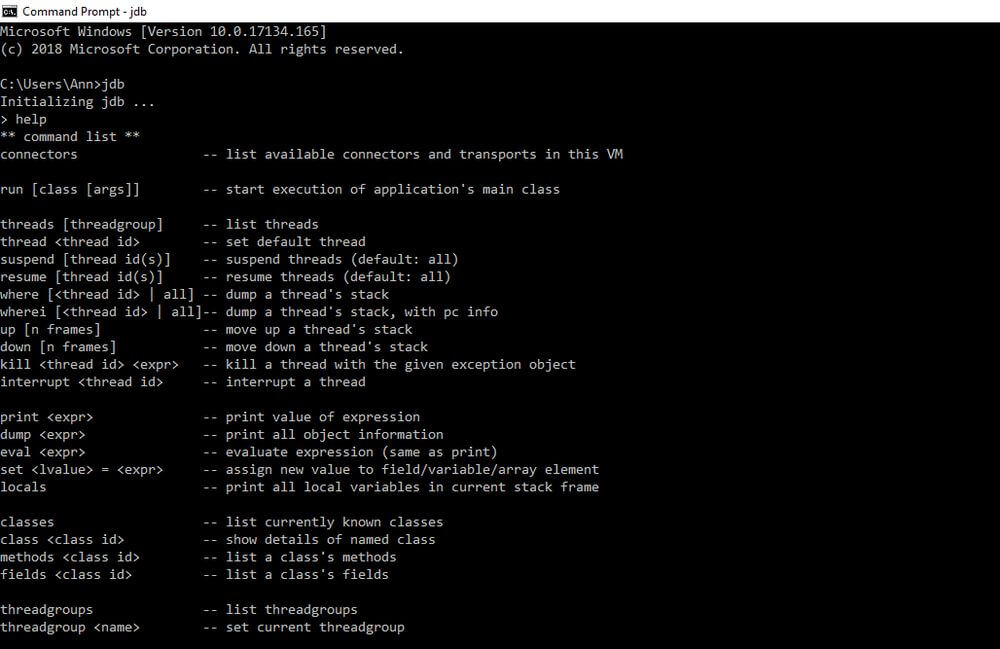
If you can’t (or don’t want to) use external software for Java debugging, it’s also possible to debug Java applications from the command line. The Java Debugger (jdb) is a simple command-line debugger provided by Oracle. It’s the equivalent of the GNU Debugger (gdb) for the Java Virtual Machine. The Java Debugger is included in the Java SE Development Kit, so if you have JDK installed on your machine, you don’t need to do anything else. You can start the debugger with the jdb command and access the list of commands using the help command.
The Java Debugger is, in fact, a demonstration of the Java Platform Debugger Architecture (JDPA). JDPA is a collection of three interfaces: JVM TI (Java Virtual Machine Tools Interface), JDWP (Java Debug Wire Protocol), and JDI (Java Debug Interface). JDPA is a debugging architecture that provides developers with tools to create their own debugger applications — jdb is just one of JDPA’s possible uses.
The jdb debugger lets you perform in-depth debugging sessions in the command line. With jdb debugger, you can:
- List, suspend, and resume threads
- Evaluate expressions
- Print all object information
- Set breakpoints
- Watch fields
- Trace method calls
- Step through code
- Permit and prevent garbage collection of an object
A command line debugger isn’t the best choice for everyday development work because of its complexity. Yet, it comes with an advantage — portability. You can set it up on a server without too much hassle, as you don’t have to attach the server to a remote IDE debugger. This all makes jdb an ideal tool for quick troubleshooting, which is important in a production environment.
Which Java debugging tool is best for your project?
Debugging Java doesn’t have to be such a challenge. Using any of these debugging tools will make the debugging process much quicker. Each use-case will be different, but evaluating your options will help you choose the right tool for your project.
Debugging Java is easier when you know where the error is! Raygun Crash Reporting for Java helps developers detect, diagnose, and resolve issues with greater speed and accuracy. Take a free 14-day trial.