Why every developer needs to learn about source maps (right now)
Posted Aug 31, 2023 | 11 min. (2302 words)You did it! Sure, it might be four weeks overdue and late on a Friday, but you’ve finally finished deploying a long-awaited update to the web app. However, your celebrations are cut short as your phone vibrates off the table. Picking it up, you’re confronted with a developer’s worst nightmare. You’re getting flooded with messages that the login is no longer working. Was it your deployment? This is bad. Nobody can use the site if they can’t log in.
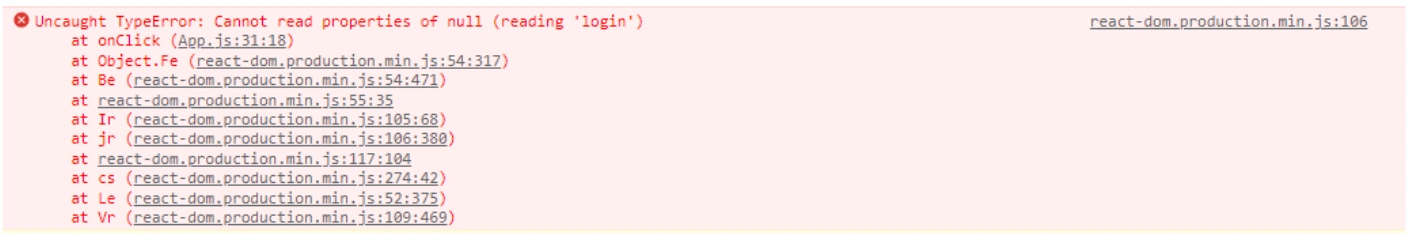
You rush back to your computer, hands shaky as you type in your password. You navigate to the production website, hit the “Sign in” button, and see the following error in the console:
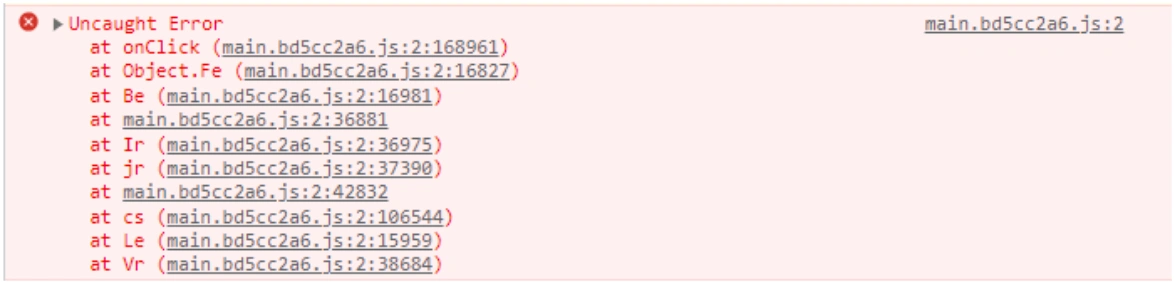
You stare at it blankly. main.bd5cc2a6.js? This file does not exist in the code base. And the error is on line 2? Line 2 is almost always an import. What’s going on here? Why is it telling you the error occurred in a file that doesn’t exist? Surely this is a mistake…
To solve this mystery, and understand the power of source maps, we’re going to have to go back. Way back, all the way to the beginning of the digital revolution.
The mystery of abstraction
Before we introduce source maps, we need to set the stage. No one can doubt the role that computers have played in fundamentally changing the world. Practically everything, from kids’ toys to toasters is powered by some form of computer. It may come as a surprise, then, that computers are dumb. Exceedingly dumb, in fact. They need to be told exactly what to do and when to do it.
Not only that, but they see the world in ones and zeros, and can only do basic math operations. This is very far from how we, as humans, think and operate. If every program had to be written in binary, the digital revolution would have likely never happened.
This is why practically as soon as the first computers were invented, so were the first programming languages. These allowed programmers to write code in a more human-friendly and understandable format, and only then be converted to machine code (a fancy name for the ones and zeros) by a compiler. This is called an abstraction, and it makes modern general-purpose computers possible.
Over time, programming languages have become more and more abstracted to make things easier and easier for software engineers. Many languages don’t even compile to machine code; they instead treat another language as the machine code and compile to that instead. A more advanced approach is to create two programming languages: the first, a nice, readable language for the programmer to interact with, which is then compiled into a second, less readable language that the computer can more easily reason about for things like optimizing speed or memory usage. This language is then finally compiled to machine code. This second language is called an Intermediate Representation.
This brings us back to JavaScript. JavaScript is one of these languages that is not compiled straight to machine code. When a user visits your website, the browser sends a background request to the server that hosts the website, which then responds with the HTML and JavaScript needed to render the page inside of your browser. This JavaScript is then compiled to an Intermediate representation by the browser’s engine which is converted to machine code when it’s run.
This might sound complicated, but most of the time, to write JavaScript code, you don’t need to worry about any of this complexity. All you have to do is write and deploy your code, and it just works, like magic.
However, this abstraction has created a gap between the code you write and what’s actually being executed. Development environments try their hardest to bridge this gap for you so that you never need to think about it. However, in a production environment, you’re often not given that kind of help. This is what is happening in our example — the browser is on one side of the gap, and you are on the other. The code location of the error it’s reporting is correct, but only for the code that it is executing. As we’ve explored, that’s not necessarily the same code that you have written.
So now we know why the error points to ’non-existent’ code, but how do we deal with that? How do we cross the gap?
Crossing the gaps with source maps
Okay, so I was oversimplifying when I said there was a single gap. In reality, there are many; each level of abstraction contains its own gap that needs to be crossed. For now, though, let’s focus on the JavaScript-related gap that is causing our unreadable error. As the code needs to be fetched across the Internet, the faster this happens, the faster your site loads for your users. Because of this, the majority of JS is ‘minified’, which basically means all unnecessary spaces and new lines are removed in an attempt to make the file as small as possible, so it can be sent as fast and cheaply as possible. This is the crux of our issue. The browser reports the error in the minified code, but we are working with the un-minified source code. How do we solve this?
This, finally, is where we come to the topic of source maps. A source map is a vital debugging tool that provides a map from the compiled or minified code back to the original source code. As we’ve seen, an error in the compiled code could be a nightmare to trace back to the root in the original code. Let’s delve into how source maps make this possible.
Anatomy of a source map
So we know what problem a source map solves, but how does it do this? A source map is a JSON file that contains the information to map the processed code back to the original source files. Here’s an example source map and an explanation of what each field means:
{
  "version": 3,
  "file": "minified.js",
  "sourceRoot": "",
  "sources": ["original.js"],
  "names": ["myFunction", "x", "y"],
  "mappings": "AAAA,0BAA0B;AAC1B,UAAU,EAAC;AACV,MAAM,EAAC,WAAW,GAAG,IAAI,CAAC"
}- Version: Indicates the version of the source map, with
3being the current version. This version is not specific to your application, but the version of the source map standard. - File: Specifies the name of the minified or compiled file that this source map corresponds to.
- SourceRoot: An optional property that can specify a root URL for all the sources (left empty here).
- Sources: An array of paths or URLs for the original source files. In this case, there’s only one source file called
original.js. - Names: Lists some of the symbols that might be altered during the minification or compilation process.
- Mappings: Contains the encoded mapping information, which is the core part of the source map. It may look like a random set of letters but this is actually a Variable Length Quantity (VQL) encoding of information that explains how to map a specific symbol in your code to the minified or compiled code.
This is a simple example, and real-world source maps can be much more complex. The mapping information, in particular, is typically generated automatically by build tools and can be quite intricate, corresponding to the specific transformations applied to the code.
How to generate source maps
Many modern tools and compilers that process JavaScript, like Webpack, Babel, or UglifyJS, can generate source maps. Here’s a general example of how you might do this:
-
Configure your Build Tool: Most build tools have specific configurations or plugins that enable source map generation. You’ll typically set a specific option, such as
devtool: 'source-map'in Webpack, to enable this feature. Some build tools and project templates may have this feature enabled by default, check your build directory for any ‘.map’ files to see if this is the case. If you are not using a build tool you can use the aforementioned UglifyJS instead -
Ensure Server Configuration: Make sure your server is configured to serve source maps, if necessary, as some configurations might block access to these files. This is important as it is what allows the browser to convert the confusing error we saw at the beginning into something useful.
How to use source maps
When developing your code you often don’t have to think about source maps, as modern development environments can automatically use source maps to assist in debugging. When deployed to a production environment, though, this is different. Think back to the example I posed at the beginning of the article: after deploying an update to your web app, when you try to log in you get an error in the console. How do we fix this? Once the source map is generated and linked to the processed code, a modern browser’s developer tools can utilize the source map automatically. That’s it! Make sure the source map is generated and available, and the browser will handle the rest.
This is only part of the story though. It’s not often that errors will be so easy to catch. With a complex piece of software, errors could manifest in all kinds of situations due to a combination of many factors, making them much harder to catch yourself. After all, you can only find the error that you experience. How do you find the errors that your users experience? This is where error monitoring tools can take source maps to the next level.
A Crash Reporting tool allows you to see all errors that users are encountering, giving you the best possible visibility into the performance of your website. Monitoring a website without an error-monitoring service is like trying to navigate a room in the dark. You might be familiar with the layout, but without the lights on, you’re likely to miss the fine details, stumble over unseen obstacles, and take a hell of a lot longer to find what you’re looking for.
Using Raygun Crash Reporting is like turning the lights on. With Raygun, you receive a detailed, real-time overview of issues that could otherwise remain hidden. These insights are not just about pinpointing problems; they are about understanding the context and the impact of those problems. Integrating source maps adds another layer of transparency, translating minified code back into the original source code. This makes the debugging process more efficient and aligns the development environment more closely with actual user experiences. Like a browser, Raygun can automatically fetch your source maps if they’re available publicly (can be accessed through a URL). If you’re in local development, or if you want your source maps private, you can manually upload them through the JS source map center in your application settings.
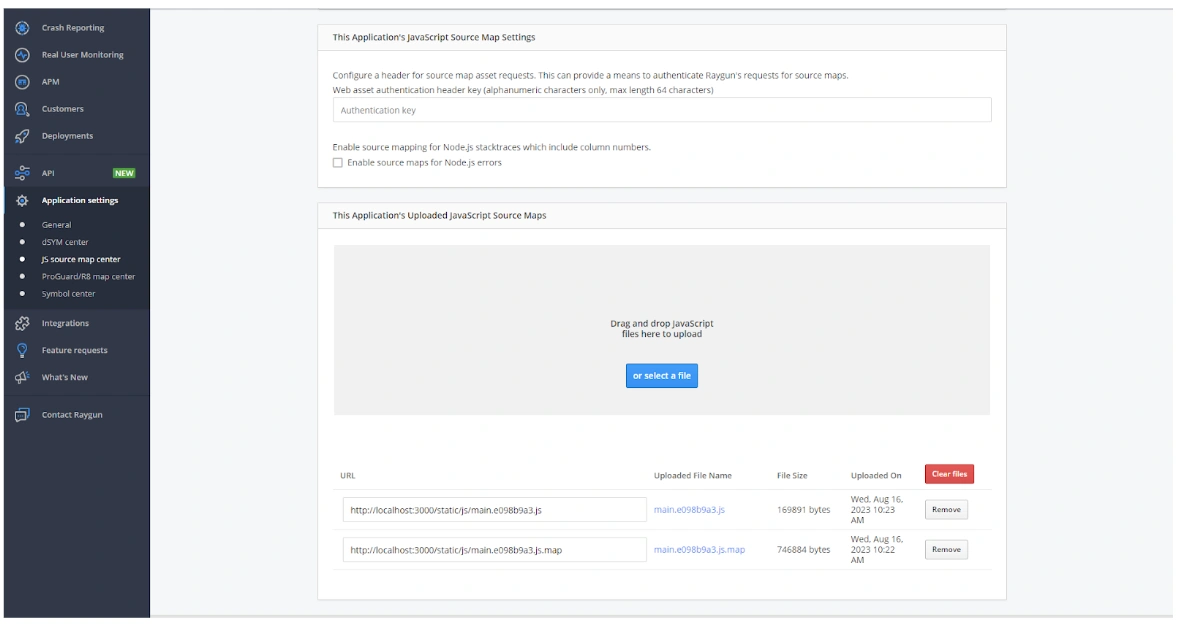
It’s as simple as uploading your JavaScript files and source map files and telling Raygun what URL they would have been available from. As Raygun tries to fetch the source maps automatically, the URL field tells it that if you are looking for a source map at this URL, use this uploaded file instead. Here, this was done because Raygun cannot fetch from a ‘localhost’ URL, but the process is the same if you’re intentionally keeping source maps private.
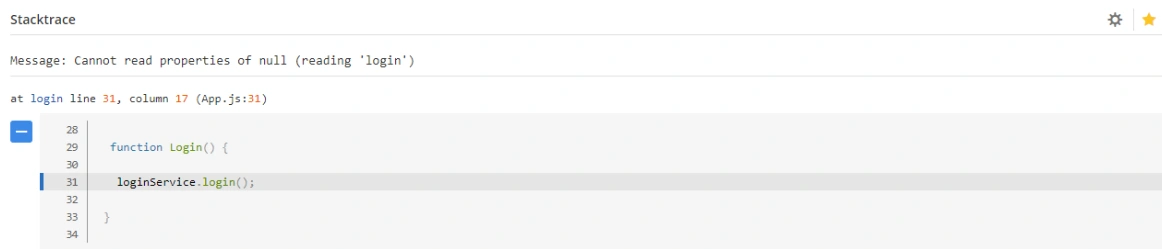
Below you can see examples of how our stack trace looks after enabling sourcemaps. While the browser gives you a basic stack trace, Raygun goes above and beyond by providing the data in a more readable format as well as code snippets.
Here’s how stack traces look in the browser development console:
Compared to how stack traces appear in Raygun using the power of source maps:
I’ll let you decide which one would be nicer to work with.
What about other languages?
The gap between the code we write and what is actually executed is a common challenge across programming languages. While this post is primarily focused on JavaScript, it’s important to recognize that most languages implement concepts similar to a ‘source map’. Whether through debug symbols, debug information, or other specialized tools, they all solve the same problem in similar ways.
Coming full circle
We have seen how source maps are essential in bridging the gap between the code that developers write and the code that is actually executed. This connection is vital not just for immediate debugging needs but for maintaining a robust, responsive system that provides the best experience for users.
Source maps, or their equivalents in other languages, are an essential component of modern development, saving hours of frustration and leading to a more reliable product.
In our disastrous deployment scenario, a source map would have been the key to quickly identifying the error that broke the login function. It would have turned a long and stressful troubleshooting session into a quick fix, saving time, frustration, and potentially, the company’s reputation.
If you haven’t already, now is the time to get acquainted with source maps in your development process. Whether you’re working on a small personal project or part of a large development team, the investment in understanding and utilizing this tool will pay dividends in efficiency, accuracy, and overall code quality. You’ll be better prepared to respond to errors quickly and accurately.
Remember, the ease and sophistication of modern programming is in its abstractions, but those abstractions can also be the source of confusion and complexity. Source maps are a powerful tool to navigate those complexities, providing a clear pathway from the code you see to the code that is executed. Don’t let your code remain a mystery; take advantage of source maps now.
If you’re ready to accelerate debugging and take a more sophisticated approach to errors, grab a free 14-day trial of Raygun Crash Reporting. You don’t have to plug in any credit card details to get started and you’ll be able to see live error reports in just a few minutes.
Further reading: