Debug JavaScript in Microsoft Edge in 7 steps
Posted Jul 29, 2020 | 10 min. (2024 words)This article will focus on debugging JavaScript code within Microsoft Edge Developer Tools. The Edge DevTools are a powerful toolset built into the Edge browser on Microsoft Windows 10. The DevTools are also available as a standalone app to download from the Microsoft Store, if one prefers to run them separately from Edge itself.
We’ll be using Raygun Crash Reporting to find the stack trace and the line of code the error occurred on. You can sign up for a free 14-day trial here.
The steps we are going to follow are:
- Sample project introduction
- Analyze a Raygun error report
- Explore the anatomy of Edge’s Developer Tools
- Add breakpoints to your code
- Step through your code
- Determine the state of your application
- Fix the bug!
So, let’s dive in!
Step 1: Sample project introduction
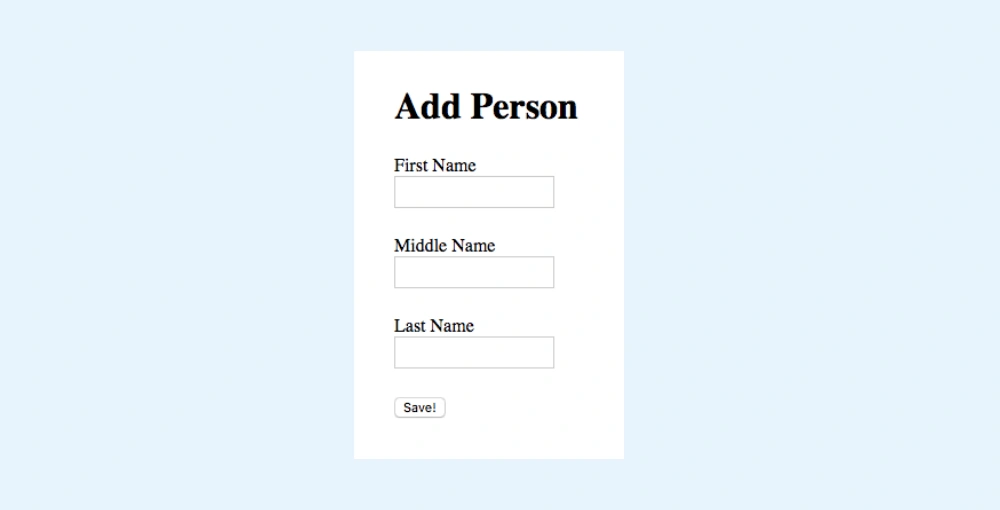
To demonstrate how to debug an application with Edge’s Developer Tools, I’m going to use a simple Add Person form. This form allows you to enter a first, middle and last name. On clicking the ‘Save’ button, the form will do a bit of processing, and the data will be sent off to your (imaginary) server.
The code for this form has three functions:
- A click handler
- A capitalize string function
- A save function
var saveButton = document.getElementById('saveButton');
var firstNameField = document.getElementById('firstName');
var middleNameField = document.getElementById('middleName');
var lastNameField = document.getElementById('lastName');

function onSaveButtonClick(){
    var firstName = firstNameField.value;
    var middleName = middleNameField.value;
    var lastName = lastNameField.value;

    // capitalize the names
    firstName = capitalizeString(firstName);
    middleName = capitalizeString(middleName);
    lastName = capitalizeString(lastName);

    doSave(firstName, middleName, lastName);
}

function capitalizeString(value){
    return value.split('')[0].toUpperCase() + value.slice(1);
}

function doSave(firstName, middleName, lastName){
    alert(firstName + ' ' + middleName + ' ' + lastName + ' has been saved!');
}

saveButton.addEventListener('click', onSaveButtonClick);
Unfortunately, after shipping this to production late on a Friday evening, you start to see error reports coming into your dashboard. There’s a bug, and you need to fix it, quickly.
2. Analyze the report in Raygun Crash Reporting
Error reports that come into Raygun have plenty of info you can use to find and fix the error, so let’s have a look at what we’re dealing with.
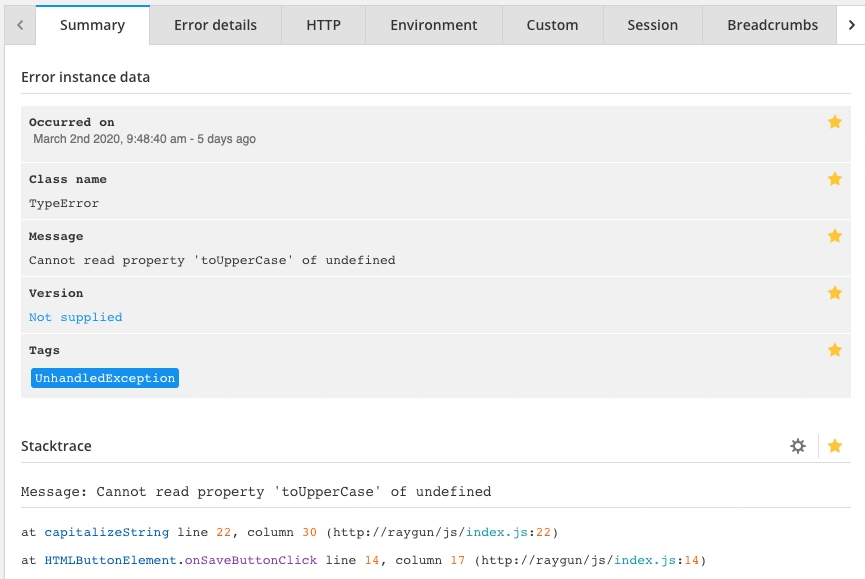
The information you will need to debug the error is located in the Stacktrace module.
The Message part of the Stacktrace is a short overview of what is wrong. In this case, the toUpperCase method is being called on an undefined value.
The Stacktrace tells you where the error occurred and the sequence of function calls that led there. As you can see in the screenshot above, the error happened in the capitalizeString function on line 20 of the index.js file.
Knowing which line triggered the error means you can jump straight to the place where the error occurred and start digging into what has caused the problem.
3. Exploring the anatomy of the Developer Tools
The first step is to launch the app in Edge and open up the Developer Tools. You can do this from the menu in the upper right corner, and then selecting More Tools > Developer Tools, or by pressing F12.
The DevTools will now be open inside the browser tab, and the Console tab will be active. If it is not, select the Console tab. This tab allows you to execute arbitrary JavaScript code at any time or to view any outputs from console.log calls.
Try entering alert('Hello!'); and hitting Enter — you should see the alert appear straight away.
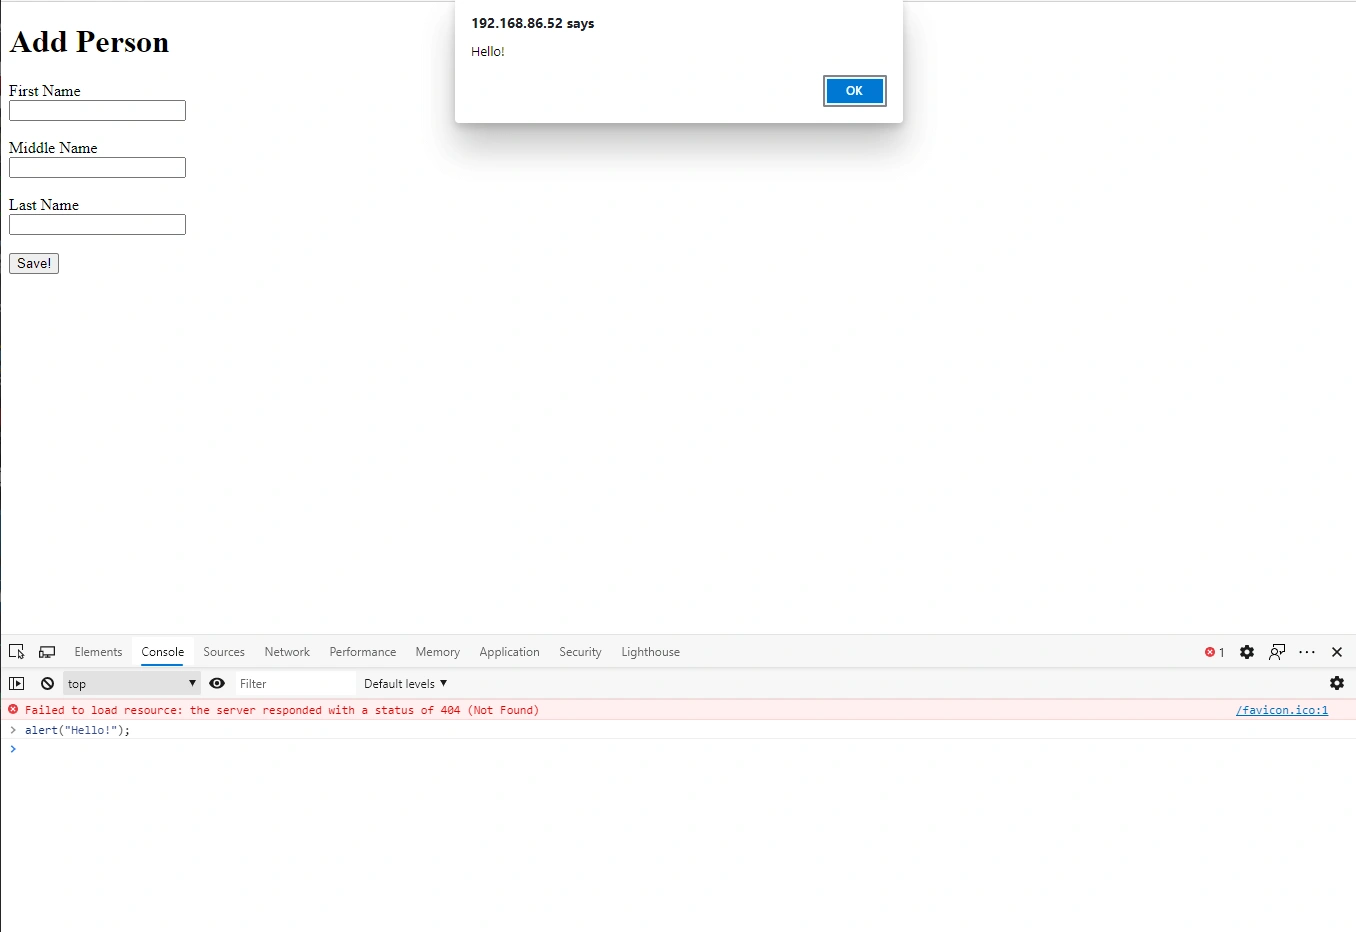
The Console tab is a valuable debugging tool as you can use it as a scratch pad for trying out code and evaluating variables as you diagnose your problem.
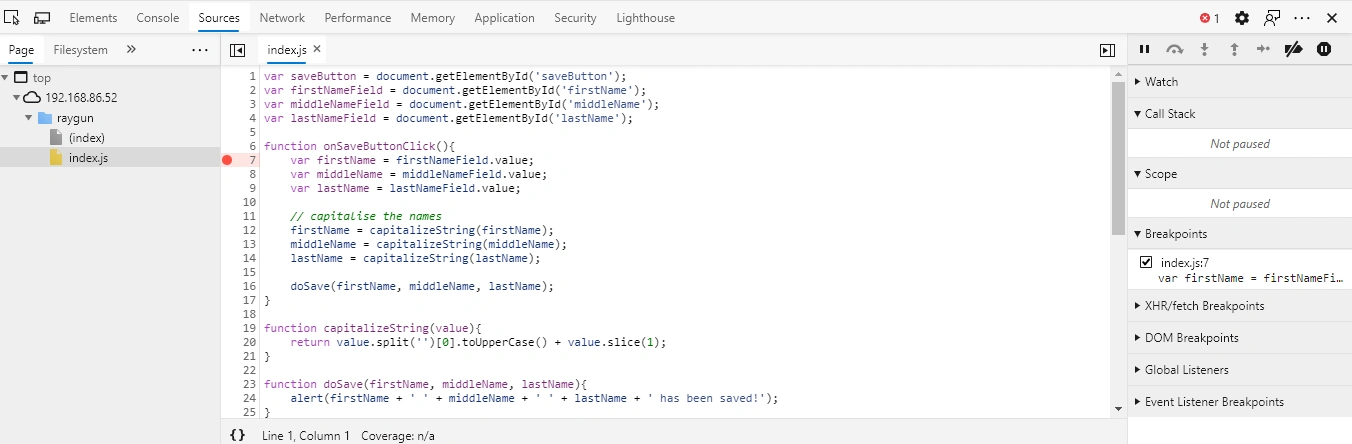
To debug the code, you first need to be able to navigate through your source code in the DevTools. You do this in the Sources tab.
The left pane inside this tab has a list of all the source files loaded into the page. You can click any of these file names, and the contents are displayed in the central pane. There is an additional pane containing debugging tools on the right side as well.
In the app, you know the problem lies in the index.js file, so select it from the list on the left to view its contents.
Step 4: Add breakpoints to your code
Now you can view your code, we want to be able to step through it a line at a time to see where things go wrong. To do this, we use breakpoints. Breakpoints are markers at specific points in the code which stop execution so you can inspect the state of the code at that point in time, and continue execution line-by-line.
There are a few different ways to add breakpoints.
Line breakpoints
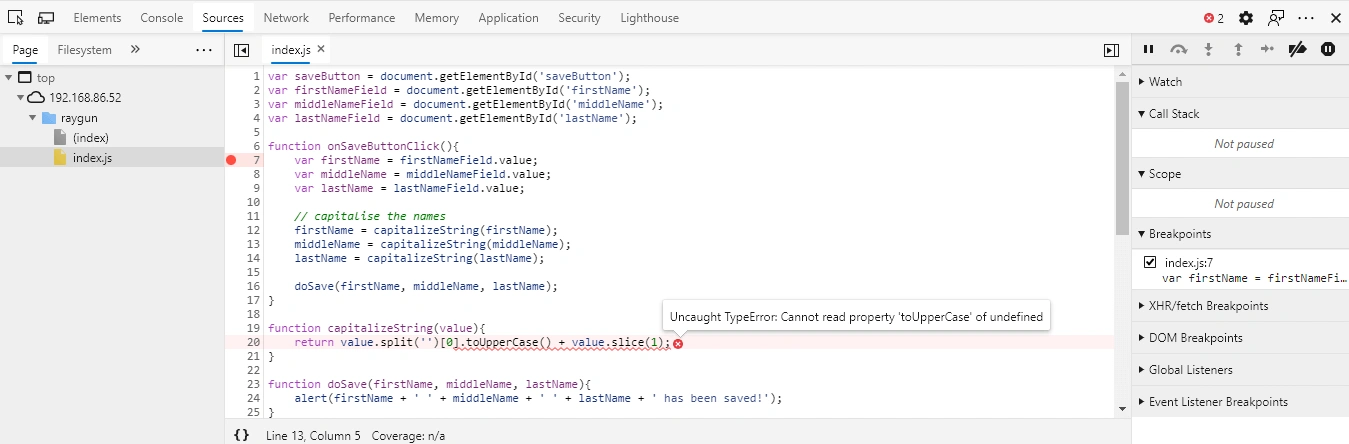
Probably the most common way to add a breakpoint is to find the specific line you want to stop on and add it there. Navigate to the file and line you are interested in and click the line number. A red marker will be added on that line and execution will stop every time it hits this line of code. In the screenshot below it will stop on Line 7 of index.js.
You will also notice that a list of the breakpoints you added is maintained in the right pane. This list is useful for navigating to the breakpoints quickly in a large file, or temporarily disabling them by clicking the marker beside the entry in the left panel.
To remove a breakpoint, click it again in the center pane, or in the right pane Breakpoints list, right click it and say “Remove breakpoint”.
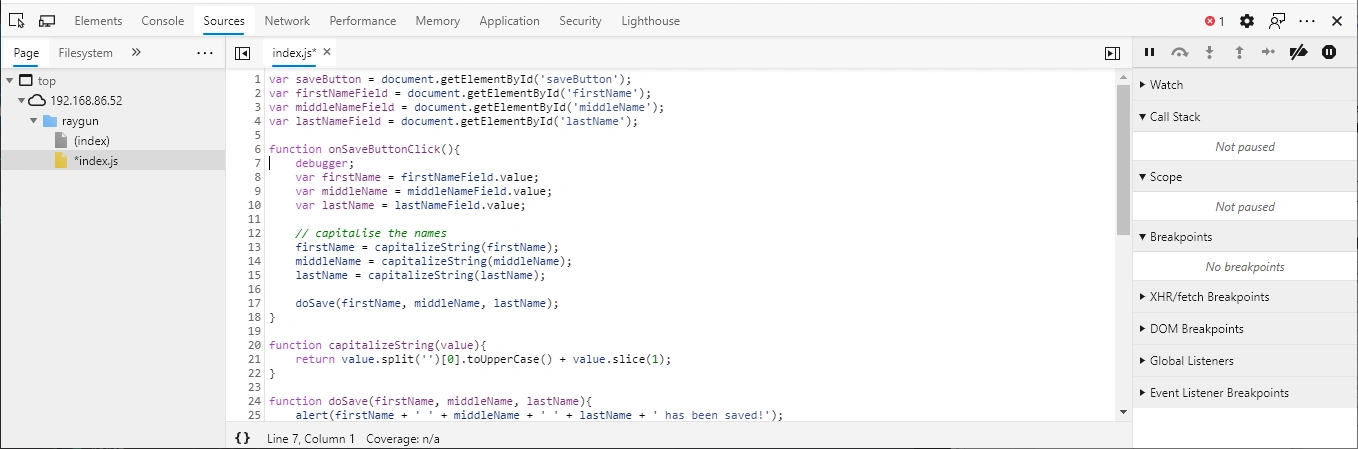
Programmatic breakpoint
You can also add breakpoints programmatically which can be useful if you don’t want to search through your code in DevTools when you already have it handy in your IDE. You can also use this approach to conditionally introduce breakpoints, for example at certain iterations of loops, or if the code runs on page load and there’s no time to add the breakpoint manually.
To do this, you add the debugger; statement at the position you want to break the execution. The code below will have the same effect as the Line Breakpoint above.
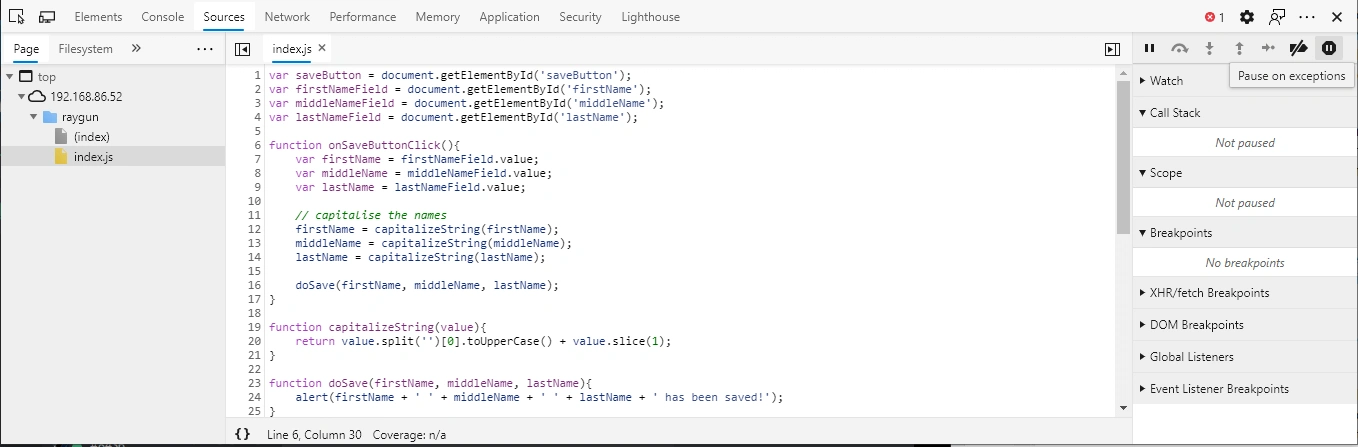
Error breakpoint
The DevTools have a handy feature which will stop execution when it hits an exception in your code, allowing you to examine what’s going on at the time of the error. You can even choose to stop on exceptions that are already handled by a try/catch statement.
To stop when any exception happens, click the stop sign shaped icon in the top right row which is described with the line “Pause on exceptions”.
Step 5: Step through your code
Now that we know how to put breakpoints into our code we now want to step through each line so we can figure out what’s going wrong. First, put a breakpoint on Line 7 — just inside the Add button’s click handler so we can start at the beginning.
In the previous section, we inferred from the Raygun error report that the error came from the capitalizeString method. This method is called three times, so, which instance is the culprit? You can look a little closer at the Stacktrace and see that it was the call on Line 13 which caused the error. You know that Line 13 relates to the Middle Name value. Therefore, you should focus your effort on reproducing the error by crafting your input correctly.
With this extra knowledge, you can fill in the First and Last Name fields but leave the Middle Name blank to see if this triggers the error. Hit the Save button. From here, the Sources tab will open where you can see that the breakpoint has activated. You can now start to step through the code. To do this, you use the buttons in the top left of the Sources pane.
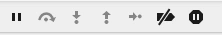
- The first icon pauses/resumes execution of your code
- The arrow moving around a dot, will “step over” this line and continue to the next
- The next icon, the arrow pointing into the dot, will “Step into” the function referred to on this line
- The arrow pointing away from the dot will “step out” of the current function and back to the next line of code
- The last of the dot and arrow icon simply indicates moving to the next step
You’re going to use these to step all the way to your capitalizeString function. So from Line 7, use the “Step over” button until we get to Line 13. The active line is shown with a green background. You can now use the “Step into” button to move into the call to the capitalizeString function.
Navigating the Call Stack
When you’re moving through the code like this, you might want to jump back to a parent function to check what was happening at that point. To do this, use the Call Stack section, shown in the right pane of the screenshot above, which lists all the functions that have been passed through to get to this point in your code — exactly the same as the Call Stack shown in the Raygun error report.
You can simply click on an item in this list and you will be moved back to that function. Bear in mind that the current position in the execution doesn’t change, so using the Step Over buttons will continue from the top of the call stack.
Step 6: Determine the state of your application
Now that you’ve navigated to where your error happened we need to examine the state of the application and figure out what’s causing the error.
There are a bunch of options for figuring out what values variables contain and evaluating expressions before the code moves on. We’ll look at each in turn.
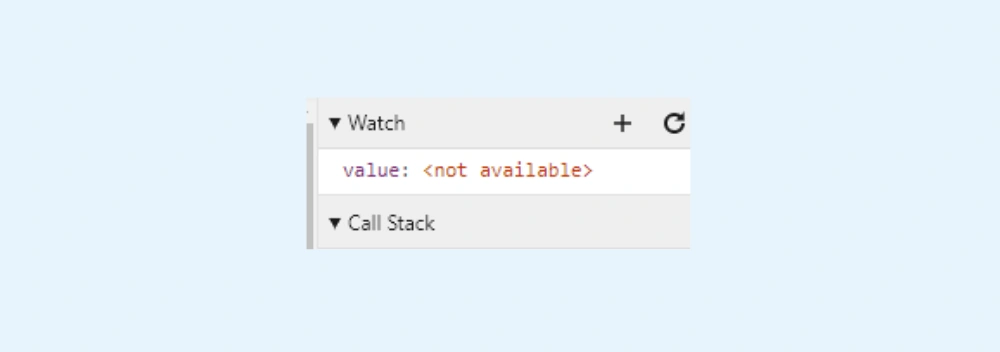
Watches
You can add expressions to the Watches panel which displays the current value of the expression as you move through the code. The Watches panel is handy to keep track of how more complex expressions change over time. You add these by clicking the “+” button at the top of the Watches panel, entering the expression to watch and hitting enter.
Console
The Console tab is a great tool for checking expression values and experimenting with code. Just switch back to the Console tab, type some code and hit enter. The DevTools will execute the code within the context and scope of the current breakpoint.
Step 7: Fix the bug
Switch over to the Console tab and let’s start to break down the line that caused the error so you can fix it.
First, check the output of the value.split(‘’) call (which is intended to grab the first character and then call the toUpperCase function on it).
Executing the expression in the Console shows it returns an empty array — this is where the error comes from! Since it returns an empty array and we try to call toUpperCase on the first item in the array (which is undefined, since there are no items in the array at all) an error results.
You can verify this by entering the full expression into the Console. To fix this problem, you need to check to see if the string is empty or undefined prior to parsing it. If it is, you need to return an empty string back without doing any processing.
function capitalizeString(value){
    if(!value || value.length === 0){
        return '';
    }

    return value.split('')[0].toUpperCase() + value.slice(1);
}
Wrapping up
That wraps up this quick intro to debugging JavaScript in Microsoft’s new Chromium Edge with DevTools. I hope you’re able to put it to use when trying to track down your next bug while using Edge. It is really worthwhile taking the time to master these tools to level up your debugging skills!
The new Edge is Microsoft’s second modern take on a browser, and its DevTools reflect that push to modernization. They’re likely to be around, relevant, and helping you debug your code on Edge for a long time!
If you’d like to learn more, we wrote a whole guide on JavaScript debugging in major browsers. Debug JavaScript in Chrome, Firefox, IE, Opera, Safari, Safari Mobile (iOS), and Visual Studio using the same process as above.