Product update: Get more context around performance issues with Real User Monitoring Insights
Posted Nov 22, 2016 | 5 min. (952 words)With more end users becoming reliant on web applications for everything from holiday bookings to grocery shopping, knowing exactly how your web application is performing is becoming more crucial to your bottom line.
Statistics show if an end user has a problem with a page on your website, they will simply leave, perhaps never to return. In fact, 64% never return to a website after a poor experience.
Keep users on your site with the powerful new addition to our Real User Monitoring tool: Insights. With Insights monitoring your public website, you’ll discover the truth behind your website performance metrics and how to improve them.
What is Insights?
Insights analyzes the public pages of your website, finds key areas of poor performance and gives actionable steps to fix them. This information is easy to access within the Raygun UI. Whether you need to drill down into exactly who was affected by an issue or gain an overview of how your performance has improved over the last quarter, Insights has you covered.
Insights brings you the following benefits:
Easy to set up
Insights is easy to integrate into your current technology stack. Simply install a few lines of code which will download the Raygun4JS provider asynchronously from the Raygun CDN. It takes less time to install than being on a coffee break!
Get weekly updates of how your application is performing
Insights systematically crawls your website for performance issues, passing pages through a set of 22 rules, 12 of which are Yahoo’s, and 10 Raygun’s own. Insights then automatically sends you an email notification. These notifications can also be triggered when a page moves below your specific page load threshold. You also have the option to have a weekly report delivered straight to Slack or JIRA making information easy to access.
Find out exactly what is wrong and how to fix it
If you’ve ever spent hours wondering exactly why an issue is occurring, you’ll know it’s time that can be better spent elsewhere.
Insights takes website performance monitoring and optimization to a new level by crawling your website pages periodically for page health, speed and user experience. Insights will then offer actionable guidance on how to fix the issues based on industry best practices.
It’s like having an extra employee keeping watch over your website performance!
Get reports based on real data (never synthetic)
Understanding how your end users are navigating your application is data that will help improve your website application. Reliable and up to date data is imperative to UX, SEO and your bottom line, which is why Insights never uses synthetic data.
Enhance your development workflow
Insights is designed with your development team front of mind and fits seamlessly into your development workflow. The actionable tasks that Insights provides enables an easy way to improve website performance and allows front end developers to spend more time developing and less time scouring for the best ways to fix performance issues.
Let’s take a quick sneak peek at exactly how Insights looks inside:
A sneak peek inside Insights
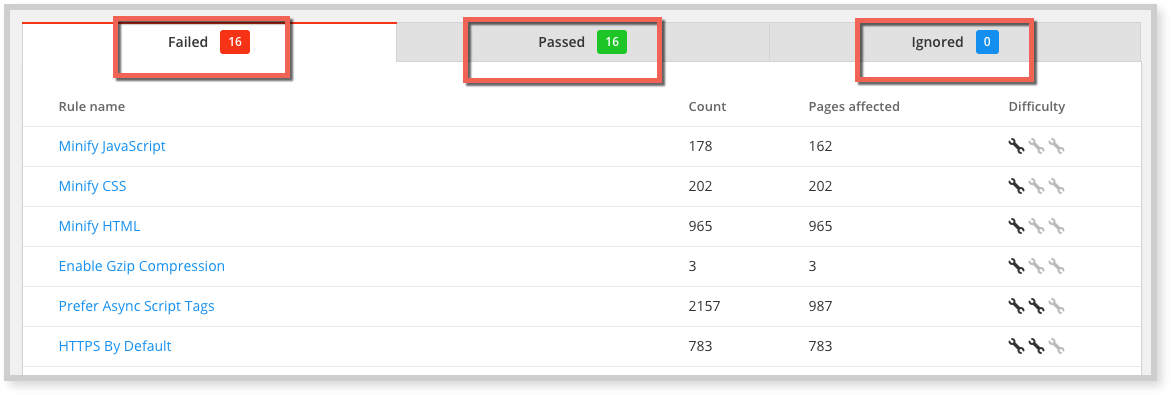
The main ‘Rules’ tab (shown below) gives a clear indication of whether a page passed or failed any of the 22 rules that Insights uses to assess website performance. This information is shown in a clear visual format including exactly which pages passed or failed categorized by each rule:
Find out why a rule is important
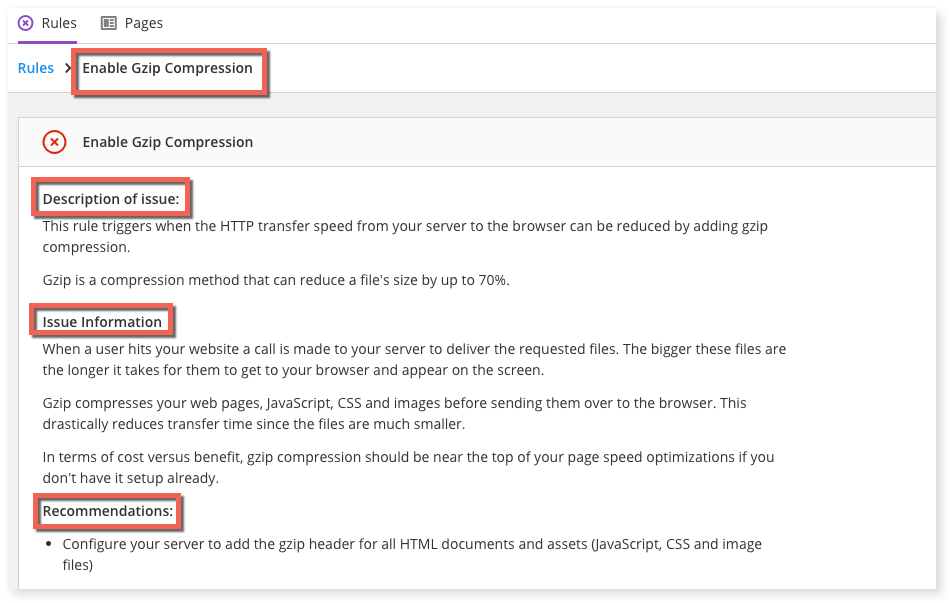
Being able to prioritize performance fixes is one of the main advantages of Insights, which you can do by clicking on a specific rule in the ‘Failed’, ‘Passed’ or ‘Ignored’ tabs:
Each rule will have its own detailed page which provides you with more information. Here you can see a description of the failure ‘Enable Gzip Compression’, detailed information and recommendations on how to implement the fix:
Improve the speed of your most viewed pages
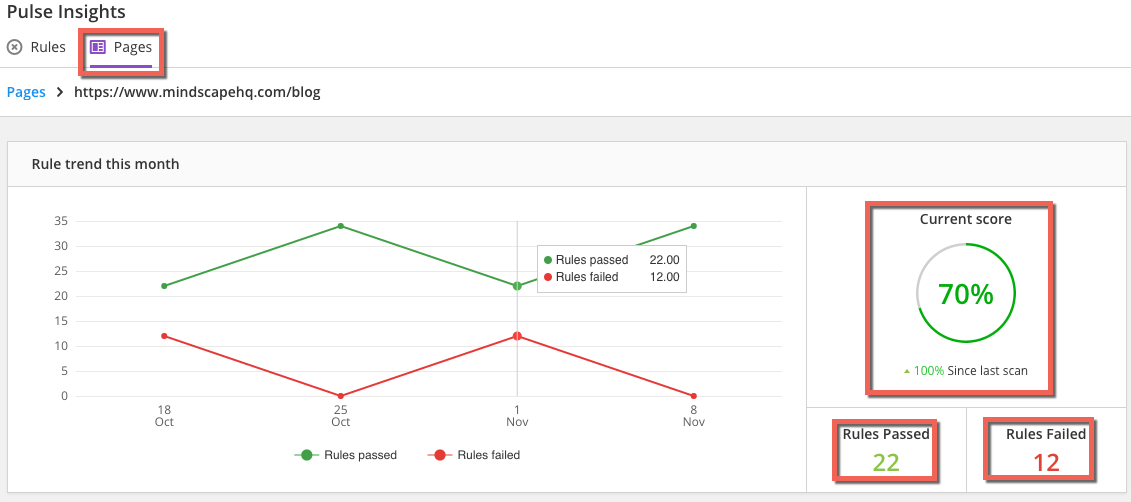
We know that each page on your website will have a different priority for fixes. Your payment pages, for example, will take priority for fixes over a low traffic page. Real User Monitoring does the heavy lifting here by scanning your website for data, while the Insights ‘Pages’ tab allows you to search for a particular page on your website to see exactly which rules it passed or failed, plus an overall ‘Current score’:
Get notified of performance issues directly to your ChatOps software
Instead of spending time moving between your web application and your Pulse Real User Monitoring dashboard, we have integrated Real User Monitoring with both Slack and HipChat.
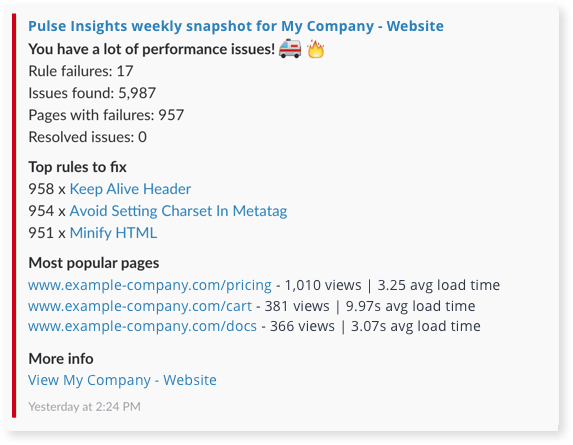
When you have enabled the integration, Insights will send you a weekly snapshot of your fixes so you can set benchmarks, triage issues and set priorities for your team.
This example shows a weekly digest of what is happening in your application from a custom Slack channel:
How to get started
Take a free trial of Real User Monitoring. Once your trial is activated, data will start appearing in your dashboard. As Real User Monitoring sends updates in real time, you’ll be able to see data straight away.
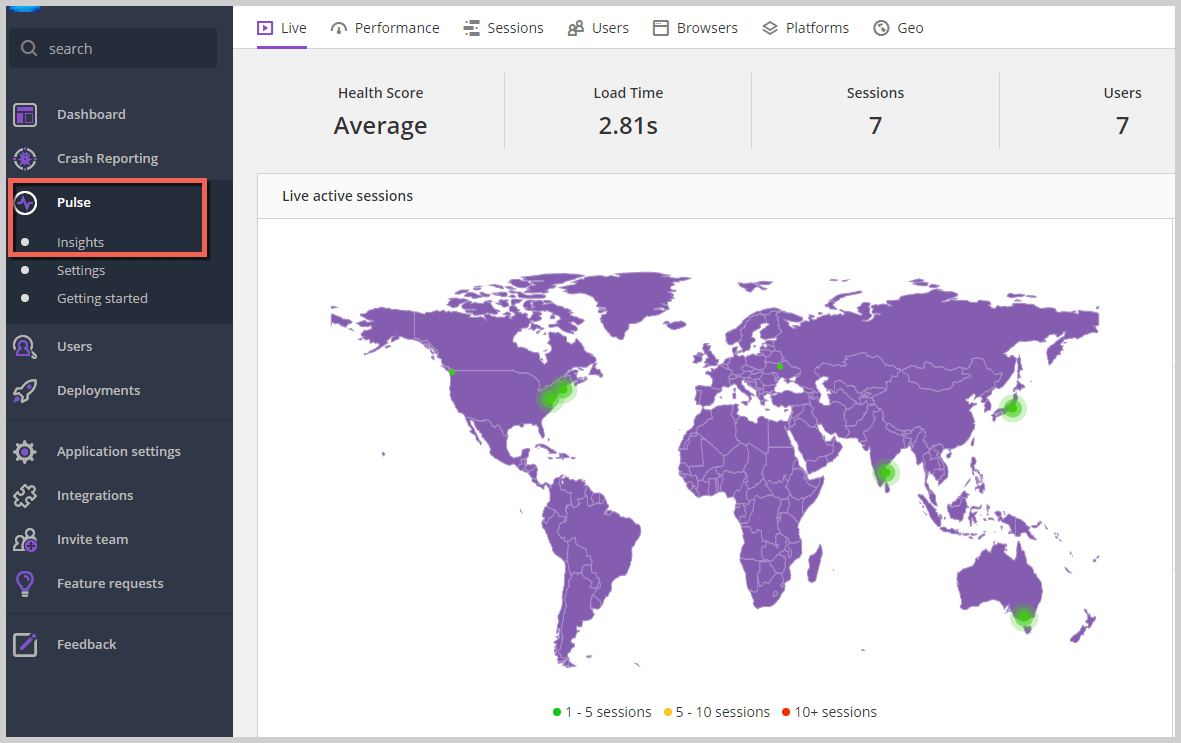
Here’s how to navigate to Insights:
Below, is the main Real User Monitoring dashboard. In the left sidebar, is the Insights menu. Simply click the ‘Insights’ menu option and Insights will appear in your main window.
Start seeing exactly where performance issues are affecting end users in the time it takes for a coffee break. Take a free 14 day trial of Real User Monitoring and get all the benefits of Insights today.
Related articles
Improve user experiences on any platform with the launch of Real User Monitoring for mobile
Tools of the trade: 10 front end development tools I can’t live without