Smarter alerts using P75 for more signal and less noise
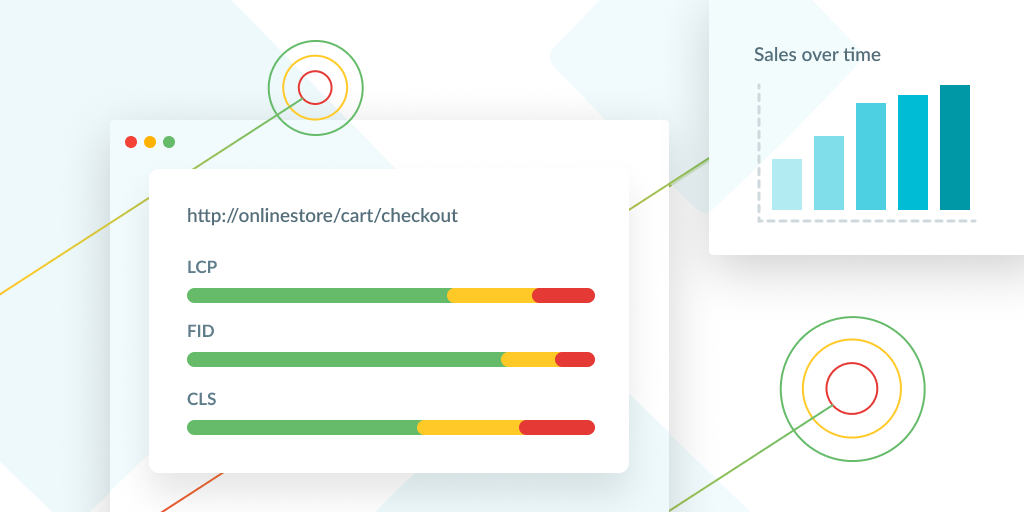
Posted Apr 10, 2025 | 4 min. (783 words)We’ve rolled out a new feature in Raygun Alerting that gives you more control over how you track and respond to performance regressions. Starting today, you can now use the 75th percentile (P75) as a filter option for page performance data in Real User Monitoring, such as Core Web Vitals and page load time, right alongside the default ‘Average’.
This option is available under the “Page/XHR performance change” condition and supports all the Web Vitals metrics we track:
- Load time
- First Contentful Paint (FCP)
- Largest Contentful Paint (LCP)
- Interaction to Next Paint (INP)
- First Input Delay (FID)
- Cumulative Layout Shift (CLS)
Let’s break down why this matters, when you should use P75, and how it gives you better, faster insights into how real users are experiencing your site or app.
Why isn’t average enough?
Using the average (mean) is fine when your data is nice and tidy—but real-world performance data is rarely clean. Performance data from Raygun Real User Monitoring tends to be noisy, skewed, and full of edge cases. One user on a flaky connection in the middle of nowhere can throw off your averages and create either false positives or false negatives.
Averages also hide distribution quirks. You could have a huge chunk of users with performance problems, but if they’re balanced out by a bunch of ultra-fast sessions, your average will look fine. That’s not great when you’re trying to stay ahead of real-world regressions.
This is where percentiles, and P75 in particular, step in.
Why does P75 matter?
P75 (the 75th percentile) tells you the value below which 75% of your users fall. In other words, it shows you what the slower end of your user experience looks like: not the worst-case, but not the best either. It’s a more reliable signal for how your site feels in practice, especially for users on mid-tier hardware, networks, or devices.
If you’re using Core Web Vitals as your north star for performance (and you should be), percentiles are already the standard. Google’s Core Web Vitals scoring uses P75 for each metric to determine whether you’re in the green, yellow, or red zones.
By aligning your alerting strategy with how performance is actually measured in the industry, you’re reducing the gap between your internal metrics and real-world impact.
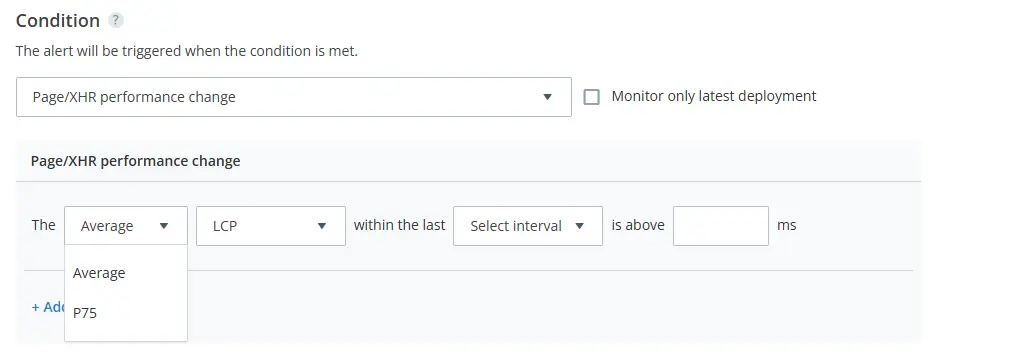
Where can I find this option?
You’ll find the new filter option under the “Page/XHR performance change” alert condition. When you go to create or edit one of these alerts, just look for the filter dropdown. Average is still the default, but P75 is now available as an alternative.
No SDK changes, no special flags, no extra setup.
When should I use P75 over average?
You’re focused on user experience
P75 gives you a view of what the experience looks like for a broader, more realistic set of users, not just the average case. This helps you catch regressions that impact large user segments.
You want better alert quality
As P75 filters out both the fastest and slowest extremes, it focuses your attention on meaningful trends rather than outliers.
You’re aligning with Core Web Vitals
Since Google measures Core Web Vitals based on P75, using the same metric in your alerts creates tighter feedback loops. You’ll spot issues before they affect your Lighthouse scores or SEO rankings.
You’re debugging tricky regressions
Some regressions only show up in certain cohorts—older devices, lower bandwidths, specific geographies. P75 surfaces these shifts earlier than the average would.
Two real life examples
Let’s say your app usually loads in 2.5s on average. One day, that average bumps up to 2.7s. Not a huge deal, right? But maybe your P75 jumps from 3.2s to 4.5s. That tells a different story—your slower 25% of users are getting crushed, and that change likely reflects a real regression you’ll want to investigate.
Or imagine you’re testing a new third-party script. Early tests don’t move the average, but suddenly your P75 is creeping up on INP. That could be causing jank for users on lower-end devices. With P75 alerts in place, you’ll spot this type of trend early, before it’s too late.
Ready to start?
This update might seem small, but it unlocks a more realistic way to monitor front-end performance. Switching to P75 for your alerts means you’re tuning into how your app feels to real users, not just what looks good on paper.
It’s a better reflection of real-world performance. It plays nicely with Core Web Vitals and it helps you catch issues faster, without drowning in noisy alert spam.
If you’ve already set up page performance alerts, you can go ahead and give P75 a try now. And if you’re not using alerting yet, this is a great reason to start!