Performance details
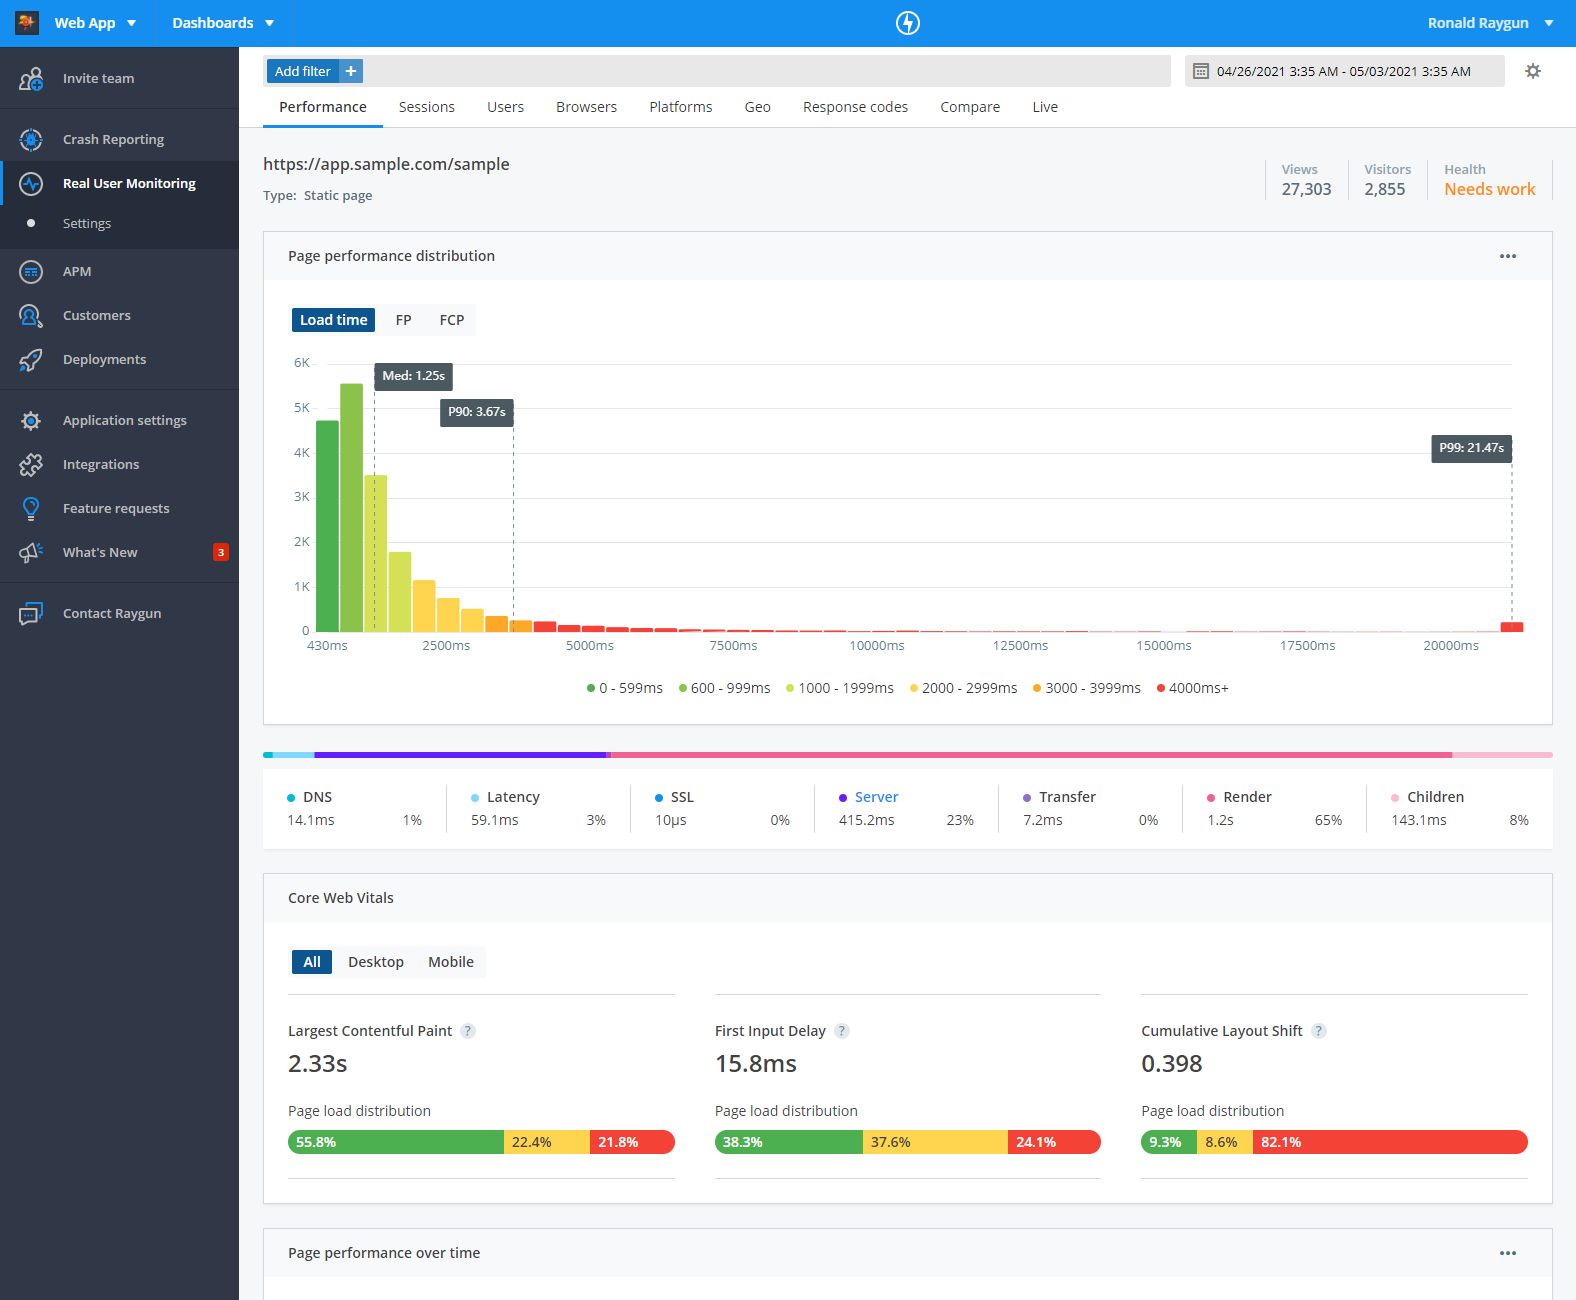
The performance details page in Real User Monitoring (RUM) displays information on the performance of pages, virtual pages and XHRs. Helping you monitor performance trends, identify performance problems, and measure the impact of optimizations you've made.
Navigating to performance details
To view the performance details for a page, virtual page or XHR click on the URI from any table on the performance overview.
Performance distribution histogram
This histogram offers a visual representation of how the majority of your users experience the page.
Static pages
For Static pages you will be presented with the page performance distribution histogram, allowing you to switch between different load time performance metrics.
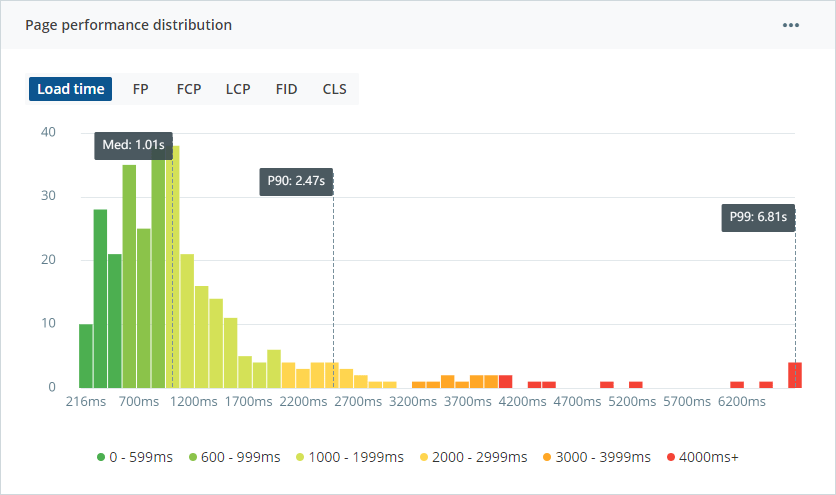
Above the histogram you can select different performance metrics to focus on the specific customer experience. Groups of bars can be (de)selected by clicking on the corresponding label in the legend below the graph.
For a static page, the histogram allows you to click on any of the bars. Clicking on a bar will display a list of sessions that viewed the page and fell between the timings represented in the clicked bar.
Virtual pages
For Virtual pages you will be presented with the total XHR performance distribution histogram.
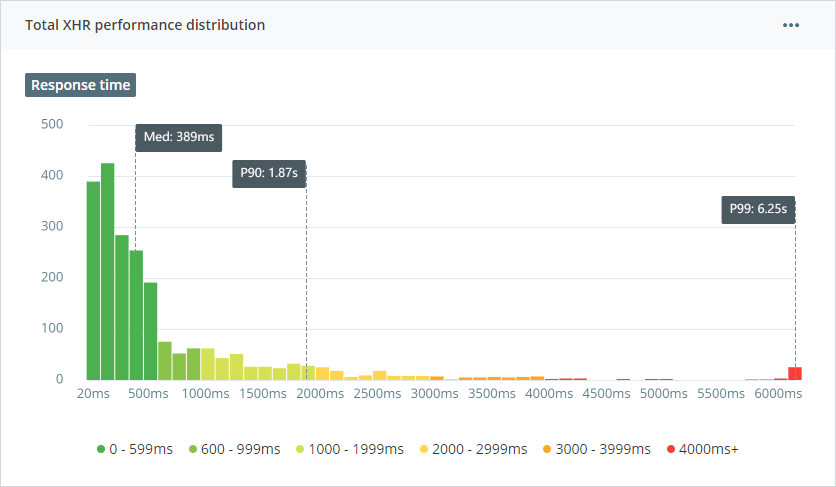
As a virtual page load doesn't have a traditional page load start/end, the histogram shows the performance distribution of XHR load times that occur for the virtual page load. With virtual pages, it's common that XHRs are triggered when the virtual page is navigated to.
note: In cases where similar XHR requests are triggered within the same page view, data aggregation may occur. When data aggregation is detected inside the histogram a total request count will be displayed at the bottom of the graph.
Controls:
The options menu on the top right of the histogram offers further controls:
-
Hide 10% slowest removes the worst performing 10% of page views for your selected metric. This helps if your graph has a particularly long tail due to outliers.
-
Logarithmic scale switches the Y-axis into logarithmic scale. This helps if any bars containing a large count are flattening the graph.
Load time breakdown
When viewing performance details for static pages you'll be presented with a load time breakdown. This graph visualises the time taken in each of the different portions of load time (DNS, Latency, SSL, Server, Transfer, Render, Children) as an average of the timings from all page views within the time range selected.
For more information on how each portion is calculated, see the performance metrics documentation.
Web Vitals
For detailed information on Web Vital metrics please see the Web Vitals documentation.
Web vital metrics include: FCP, LCP, FID, CLS and INP.
Line graph
The line graph visualizes the Average, Median, P75, P90, and P99 of each performance metric over the time range selected, enabling you to see the trend in front-end performance of a page.
Static pages
For Static pages you will be presented with the page performance over time line graph, allowing you to switch between different load time performance metrics.
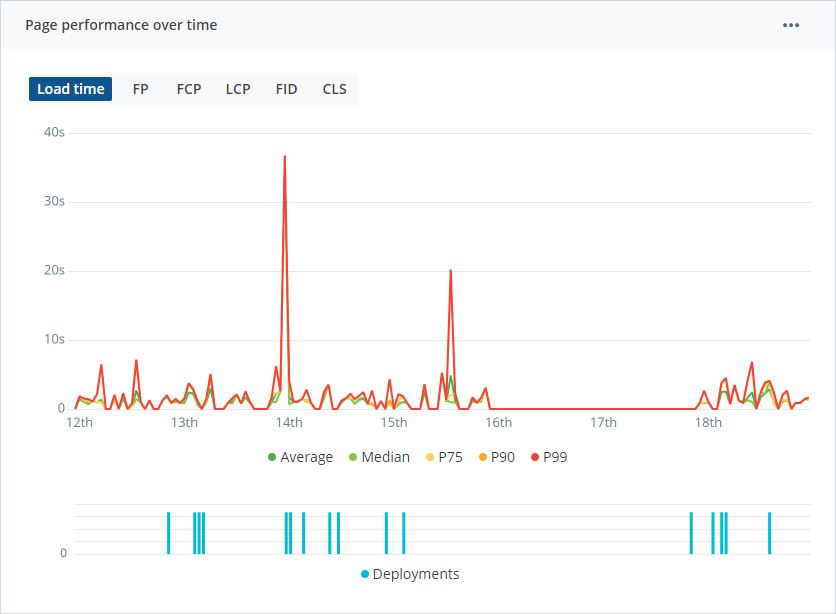
Above the line chart you can select different performance metrics to focus on the specific customer experience.
Virtual pages
For Virtual pages you will be presented with the total XHR performance over time line graph.
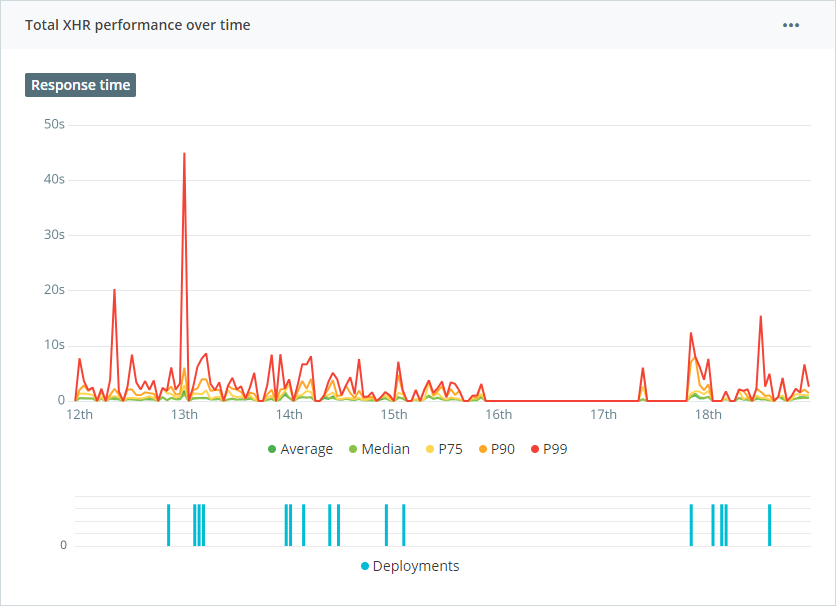
As a virtual page load doesn't have a traditional page load start/end, the histogram shows the total XHR performance over time that occur for the virtual page. With virtual pages, it's common that XHRs are triggered when the virtual page is navigated to.
Controls:
The graphs display lines for the Average, Median, P75, P90, and P99. You can hide each line by clicking the corresponding label in the key at the bottom of the graph.
Performance metrics
For more information on the metrics shown on the performance details page, and what they’re measuring, see the performance metrics documentation.
Custom timings
In Real User Monitoring, you can track custom performance measurements across your website or application using custom timings. For example, you might track the time it takes for a specific video to play, or for the search bar to load. Custom timings gives you the flexibility to track the timing on events that matter to your users or business.
For more information see our documentation on custom timings.
Waterfall timeline
This chart shows a list of the requests made to load a page and the time taken with each. The waterfall chart allows you to see exactly how a page loaded and which request/s took the longest amount of time.
You can show/hide different request types using the toggles at the top of the timeline to help focus on specific requests.
Underneath each request there is also an offset timing to show you the point within the page load where a particular request was made.
This chart is a sample waterfall timeline from a session in the time range, representing the experience of one user. It is not an average of all page requests within that time range.
XHR requests made from this page
This table shows a list of XHR calls made from the page, the number of times each has been requested, and the average response time of each. You can click on an XHR to see the full distribution of response times.
Request details
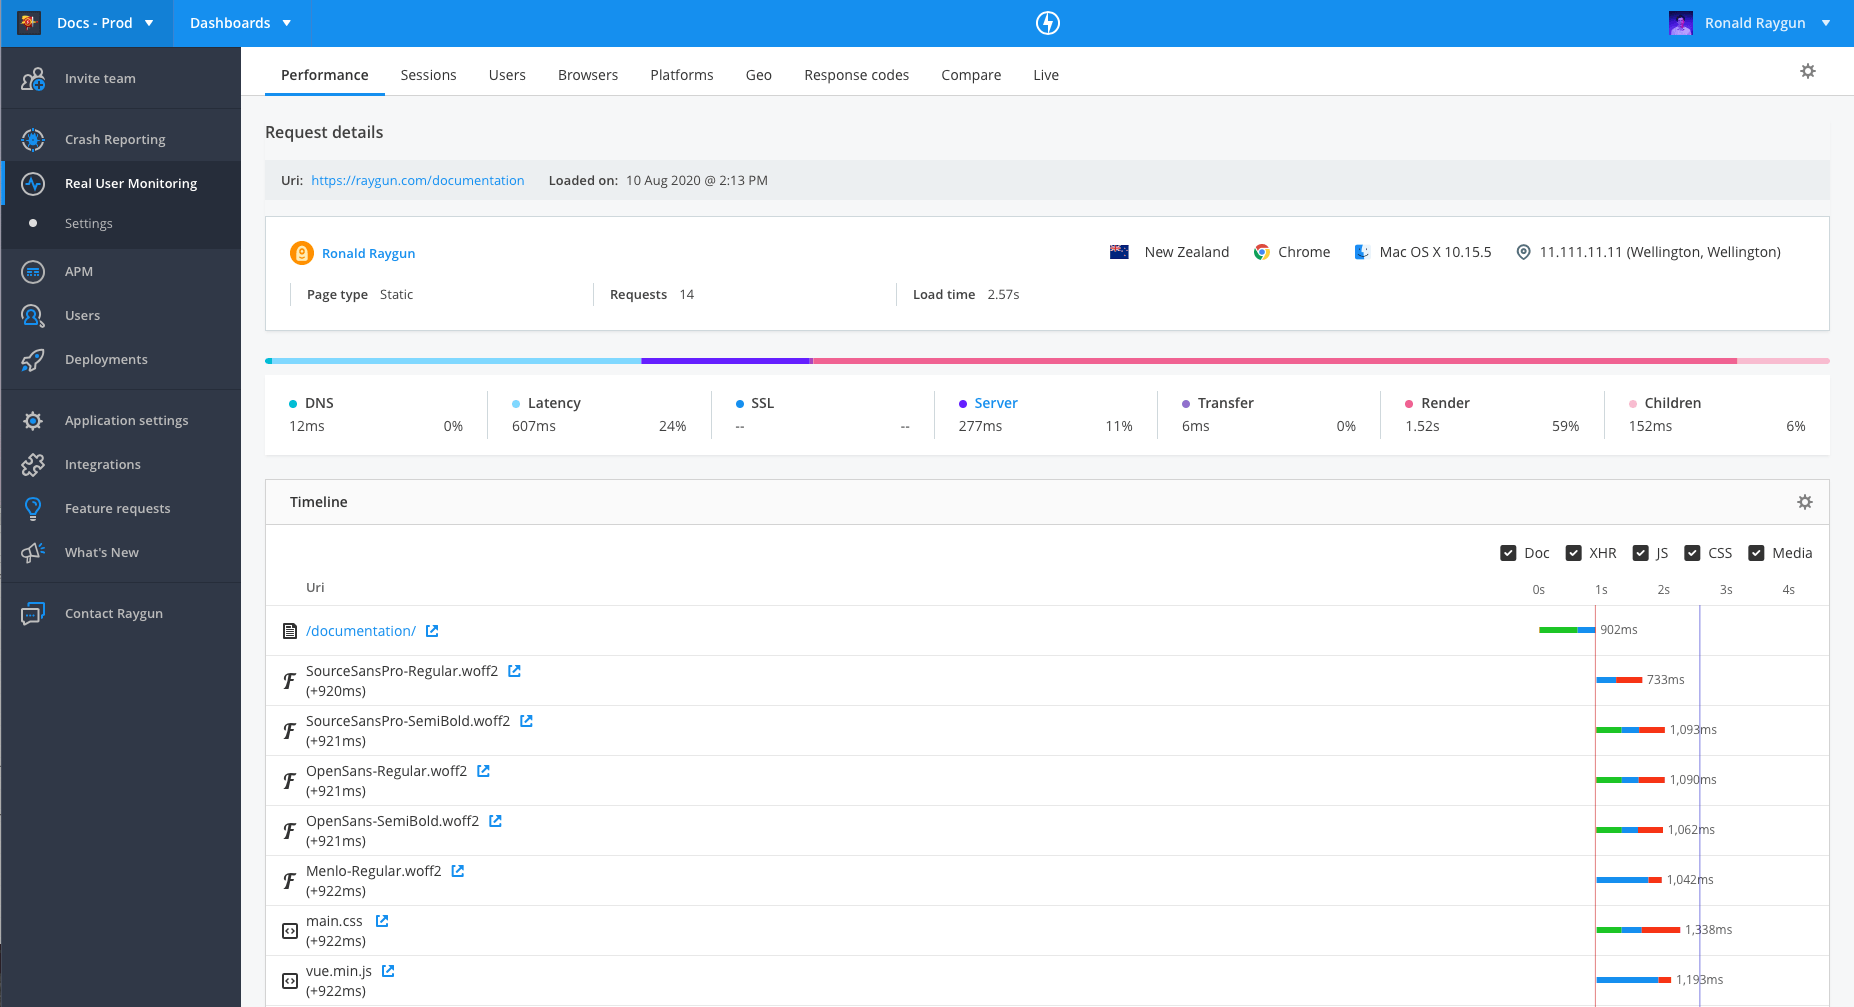
With Real User Monitoring you can view details about the performance of each page request within a given user session.
You can find more information on performance details in the request details documentation page.
Latest slowest requests
This table shows the slowest requests made for this page, the user who made the request, the country that the request originated from, and the load time breakdown of each. You can click on the URI to view performance details for a specific page request.
Up to 50 requests are displayed in this table. These are a sample from the latest 1000 requests within the time-range selected.
Using top level filters
Filters in Real User Monitoring (RUM) can be used to narrow down data based on certain parameters, enabling you to view performance information for specific segments of your users.
For example, top level filters can help you identify how page performance might differ across different browsers, geographies or operating systems. You can find more information in our top level filters documentation.
You can also filter on parameters unique to your software or business using custom tags.
Show/hide modules
There are certain modules in Real User Monitoring which you can choose to hide. These Show/Hide modules can be found within the RUM settings.